Key takeaways
- Nature accepts figures at exactly 89 mm (single column) or 183 mm (double column), with a 247 mm page depth — design to those numbers from day one.
- Reviewers reject multi-panel figures for narrative failure far more often than for aesthetic failure. Treat each panel as a sentence in a 4–7 sentence paragraph.
- Five layout archetypes show up across Nature and Science in 2024–2026: hub-and-spoke, time-march, condition matrix, pipeline, and comparative columns. Pick one before you draw.
- Seven specific issues account for most reviewer comments on figures: panel-order drift, color-blind unsafe palettes, sub-5 pt fonts, missing alphabet labels, unlabeled axes, split-axis comparisons, and filler whitespace.
- Since 2023, several Nature titles accept interactive HTML figures embedded as iframes. In 2026, this is no longer experimental — it is a real submission path for computational work.
What "Nature-quality" actually means
Most figure tutorials online obsess over DPI and font choice. Those are necessary, not sufficient. A figure with 600 DPI line art and Helvetica 7 pt can still get desk-rejected if its panels do not advance an argument.
When Nature editors describe a strong figure, the words that recur are self-contained, sequential, and story-driven. Self-contained means a reader who skims only the figure and caption can extract the headline finding. Sequential means panels read in the order of the argument. Story-driven means each panel earns its space — there is no decorative panel.
The official spec is just the floor. The bar above the floor is composition.
The 2026 editorial spec sheet
These are the numbers you build the layout grid against, before you draw a single axis. The Nature numbers are pulled from the Nature research figure guide and the formatting guide; the Science numbers come from its contributors page.
| Specification | Nature | Science |
|---|
| Single-column width | 89 mm | 55 mm (5.5 cm) |
| Double-column width | 183 mm | 116 or 178 mm (11.6 / 17.8 cm) |
| Maximum page depth | 247 mm | 247 mm |
| Photographic resolution | 300 DPI | 300 DPI |
| Line / combination | 600+ DPI | 500+ DPI |
| Fonts | Helvetica or Arial | Helvetica preferred |
| Minimum body font | 5 pt at print | 5 pt at print |
| Accepted vector formats | TIFF, EPS, PDF, AI | EPS, PDF, AI |
Two practical consequences:
- Design at final size, not "at any size, scale later." Helvetica 7 pt at 183 mm width is legible. Helvetica 12 pt scaled down to fit 89 mm is not — anti-aliasing fails, lines blur.
- Reserve roughly 20 mm beneath the figure for the legend block. Fight to keep that legend under 300 words.
The panel-as-sentence framework
This is a model that does not appear in the Nature guide but solves a problem the guide does not address: how do you compose a multi-panel figure once the specs are met?
Treat the figure as a paragraph. Each panel is a sentence. The paragraph has roles:
- Panel A — topic sentence. A schematic or system overview. The reader learns what you studied.
- Panels B–D — supporting evidence. Direct experimental readouts that establish the claim.
- Panel E — mechanism. A measurement or simulation that explains why the result holds.
- Panel F — consequence. The downstream implication, often a perturbation or in-vivo validation.
The benefits are diagnostic. If you cannot write a one-sentence label for a panel, that panel does not belong in the figure. If two panels would carry the same sentence, merge them. If panel C contradicts panel B without bridging text, you need a panel between them.
This approach also kills the most common reviewer comment on multi-panel figures: "Panels feel disconnected; please clarify the relationship between sub-panels." If your panels are sentences, the relationship is the paragraph.
Five layout archetypes that ship in 2026
A scan of Figure 1s across Nature, Nature Methods, and Science from 2024 to early 2026 turns up the same five compositions, repeated with variation. Each maps to a different argument shape.
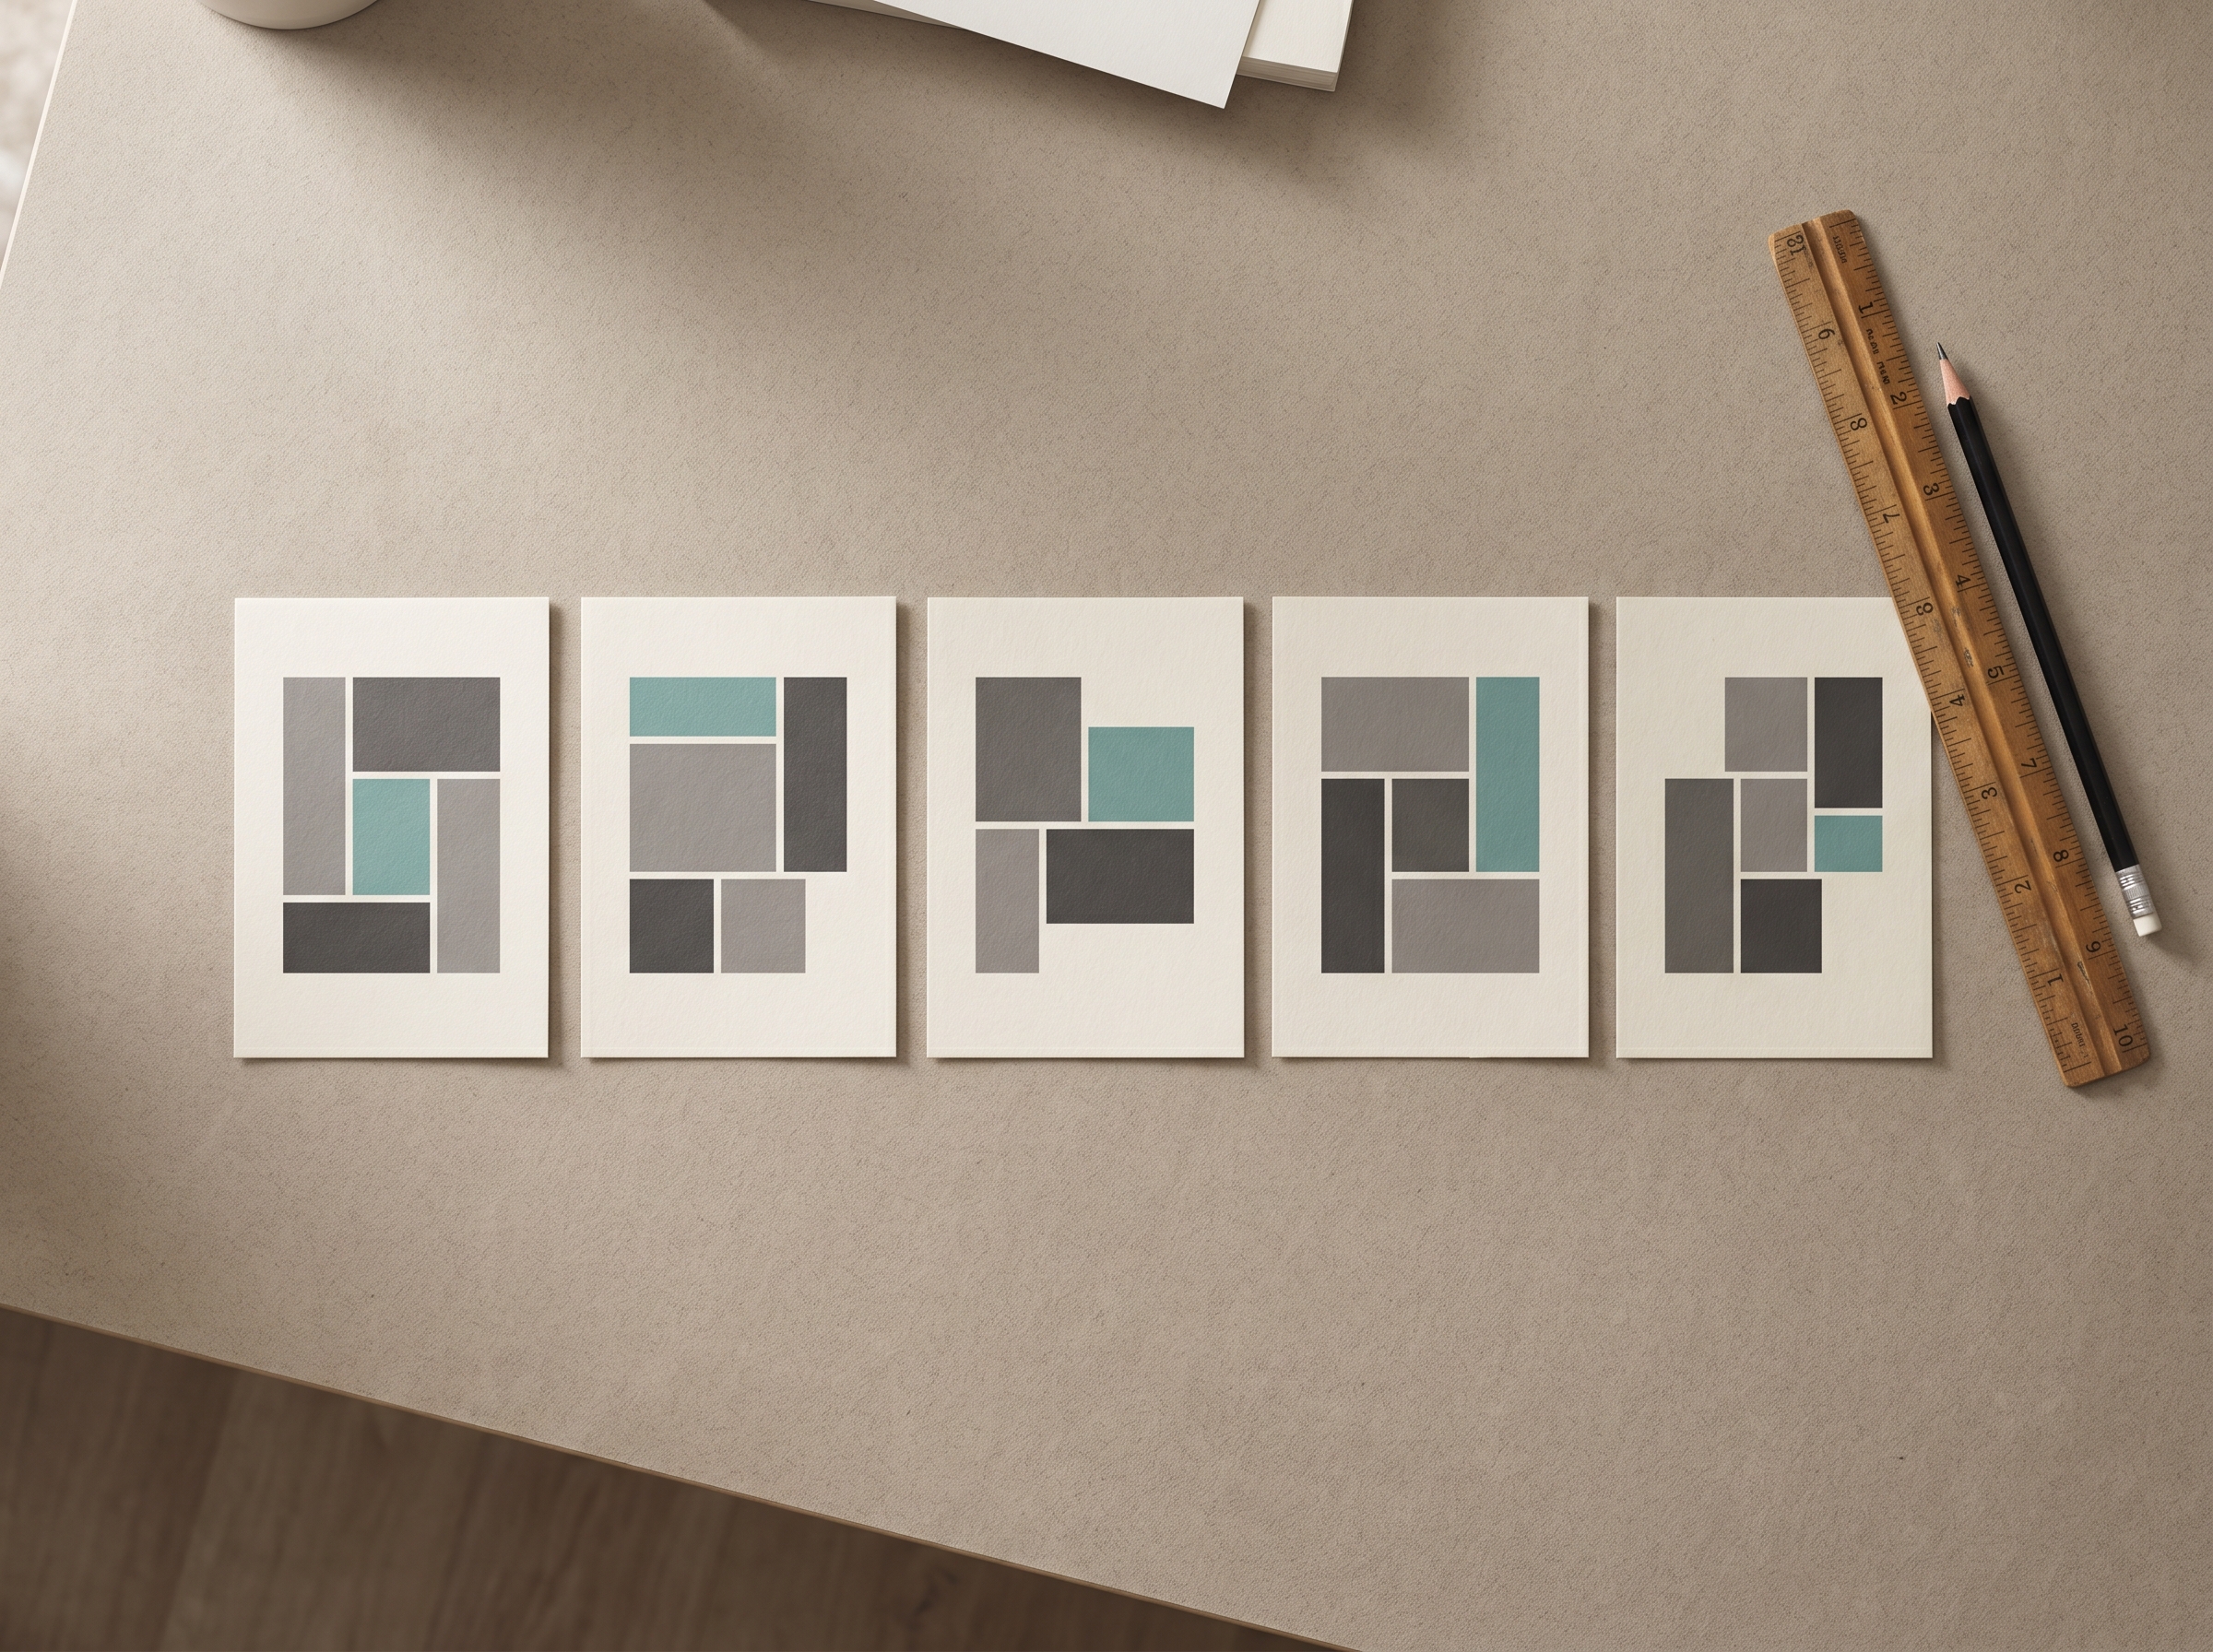
- Hub-and-spoke. A central schematic anchors the panel set; surrounding panels are zoomed-in analyses. Best when the question is "how does this complex system work?". Common in systems biology and circuits papers.
- Time-march. The same readout, ordered left-to-right at t1, t2, t3, ... Forces the reader's eye to track change without a split-axis. Best for kinetics, development, dynamics.
- Condition matrix. A 2×3 or 3×3 grid of treatment combinations. Best when you have crossed factors and the cross is the point. Reviewers love these because they make missing controls obvious.
- Pipeline. Panels are stages of an experimental flow with output at each stage. Best for method papers — the figure is the method.
- Comparative columns. Two columns: condition A vs. condition B, panel rows aligned. Best for clean cause-and-effect arguments.
Pick one before you import a single dataset into Illustrator. Drawing from a blank canvas without a chosen archetype is the single most reliable way to ship a confused figure.
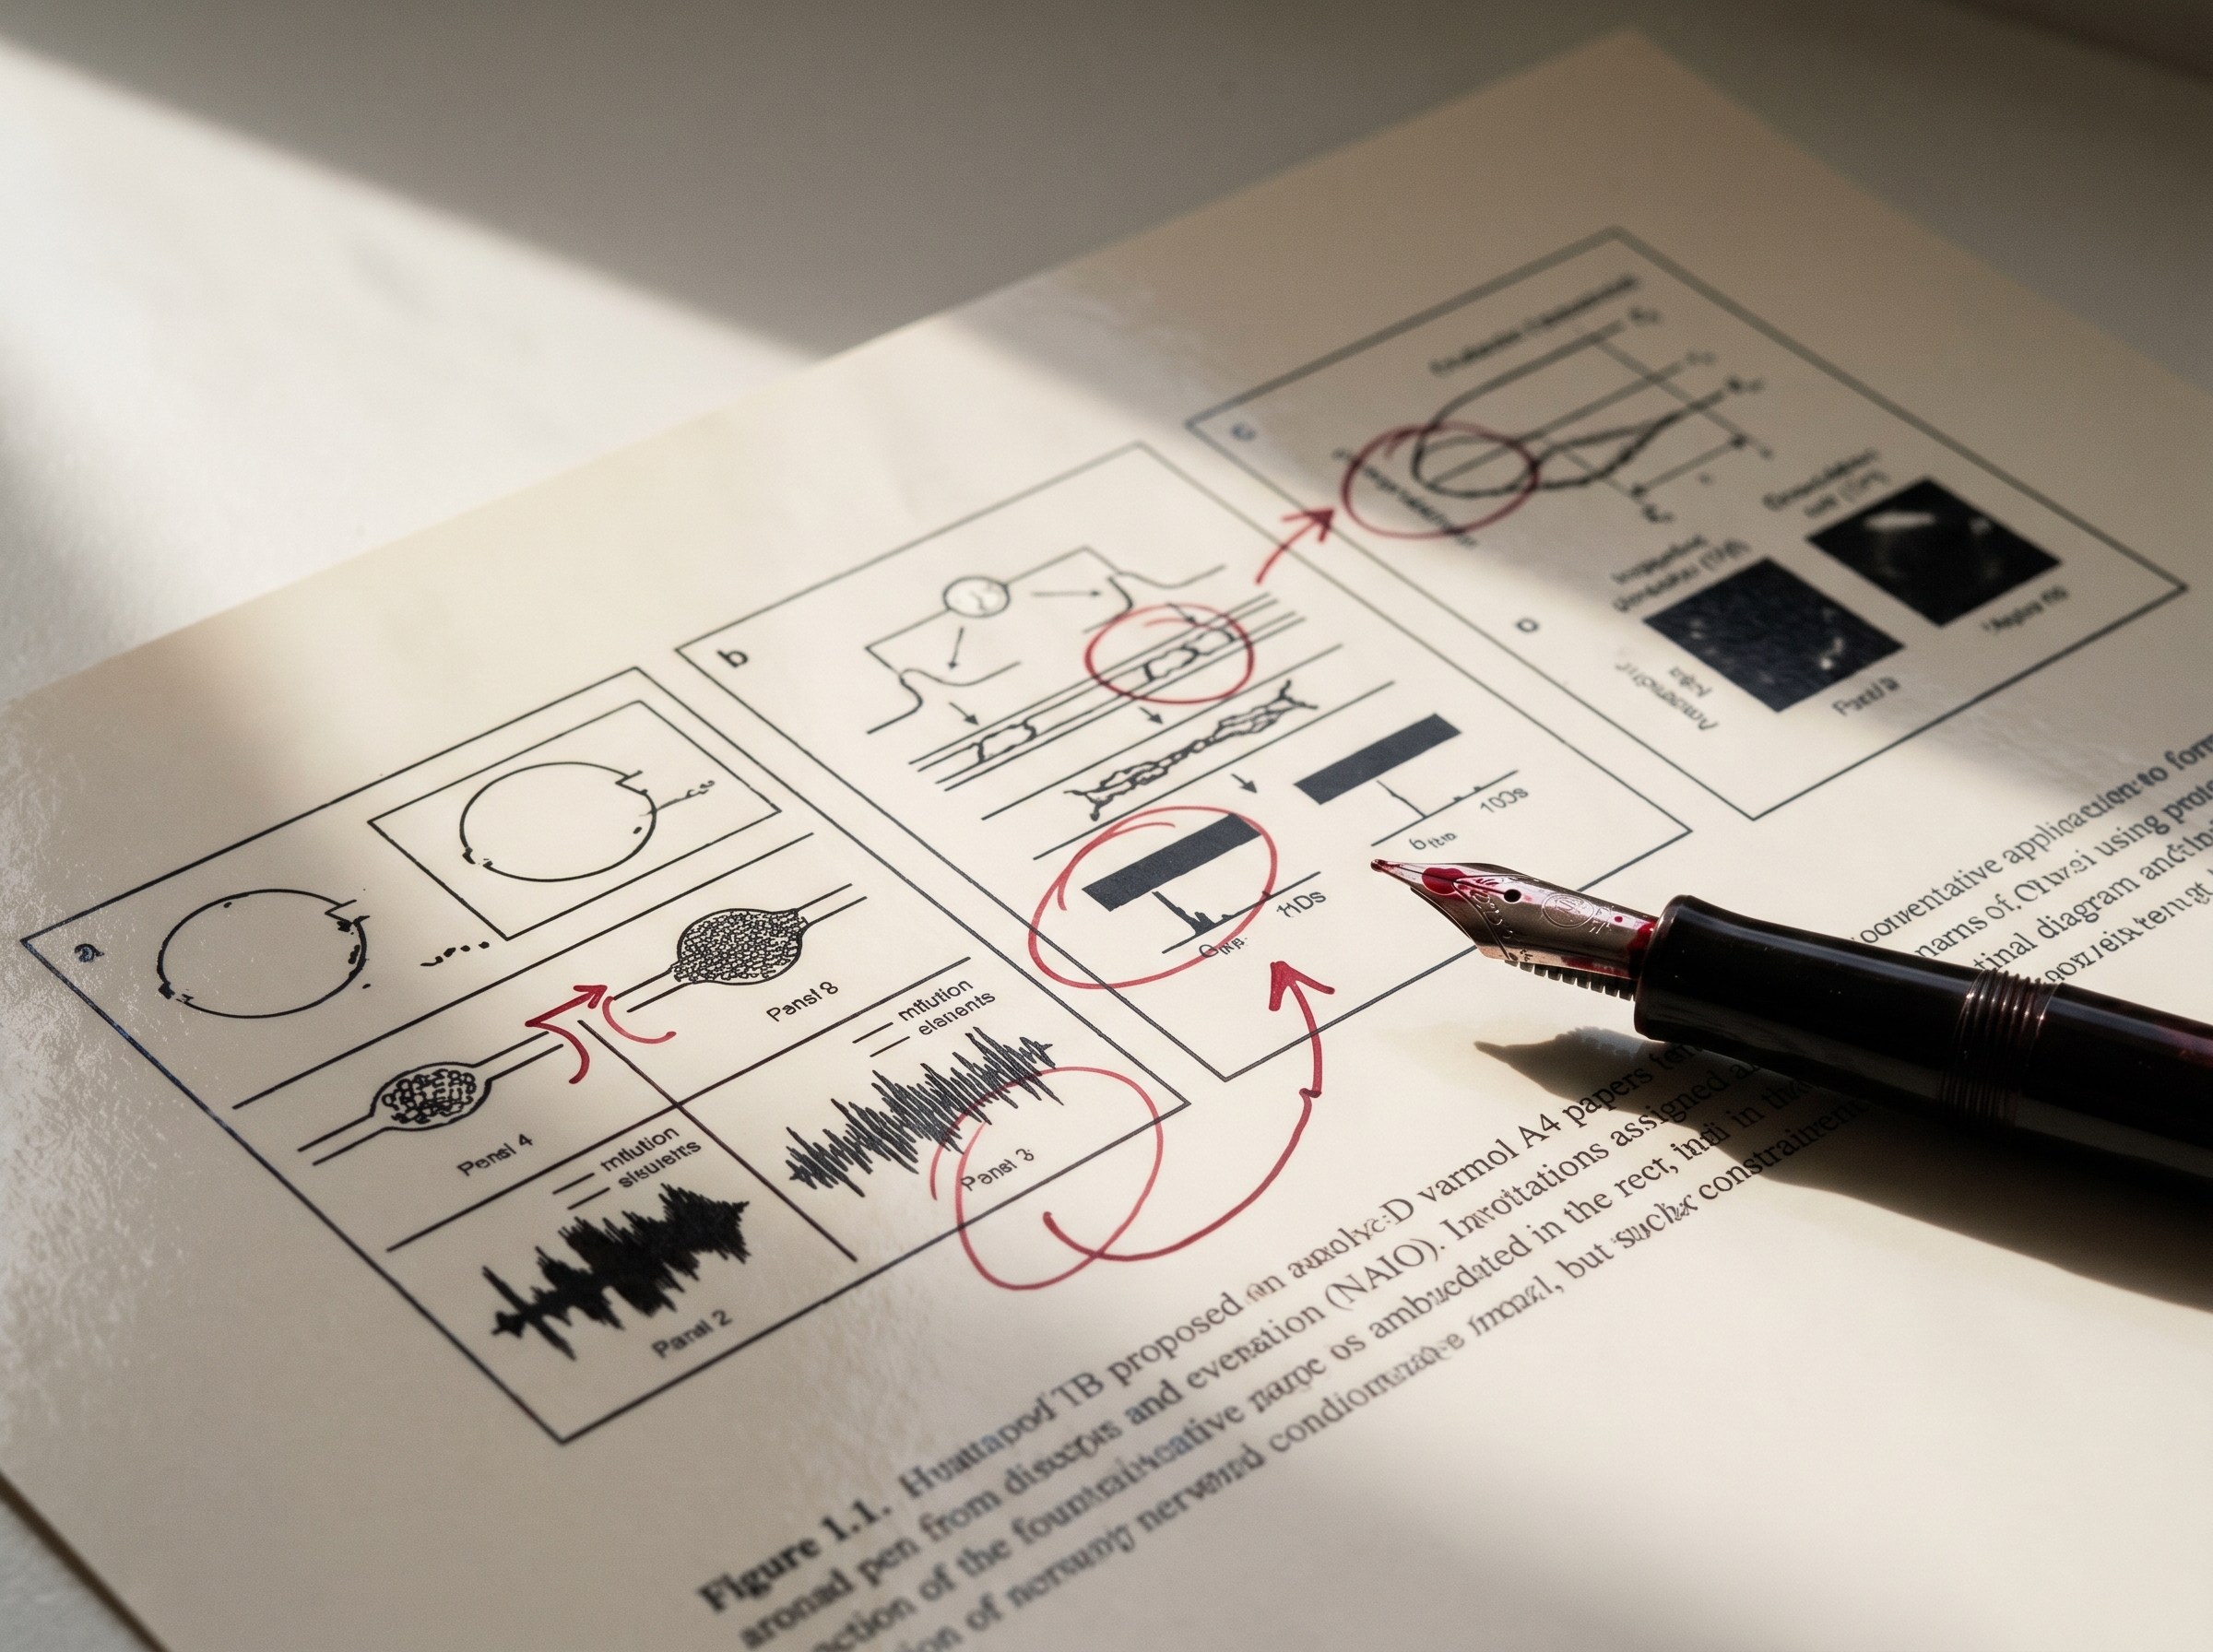
This list synthesizes recurring issues from public peer-review reports archived by PLOS and the eLife transparent review process. Names and projects redacted; the patterns are the asset.
- Panel order drifts from caption order. The caption walks A→B→C→D, but the visual reading order is A→C→B→D. Fix: lay panels out so the eye scans them in the same order the caption reads them.
- Color palette is unsafe for color-blind readers. Roughly 8% of male readers and 0.5% of female readers cannot distinguish red from green at typical figure intensities. Fix: use the Okabe-Ito palette or test in Coblis before submission.
- Body font drops below 5 pt at print size. Tick labels and legend keys are the usual offenders. Fix: build at final size and check at 100% zoom on a printed page, not on a 27" monitor.
- Sub-panel alphabet labels missing or inconsistent. "a" lower in the schematic, "B" upper-left in the chart. Fix: every panel gets a single label in the same corner, same case, same weight.
- Axes lack units. "Time" instead of "Time (s)", "Concentration" instead of "Concentration (μM)". Reviewers stop reading.
- Same-axis comparisons split across panels. Panel B has a y-axis from 0–100; panel C has 0–10. The reader has to compute the ratio. Fix: align axes for paired panels, or move them to a single panel with grouped bars.
- Whitespace exceeds the content area. Six panels on a 183 mm wide canvas, but only ~40% is data — the rest is gutter. Fix: tighten gutters to 4–6 mm; if a panel cannot fill its allotted area, the panel is too small or the figure has too many panels.
Since 2023, Nature Computational Science, eLife, and several Cell Press titles accept interactive figures embedded as iframes. In 2026, this is no longer a curiosity; it is the publication path for any paper whose key finding requires exploration to verify.
Stay static when the figure communicates a single, defensible claim that fits in a paragraph. Go interactive when:
- The data has more than three meaningful dimensions and a single 2D slice misleads.
- Reviewers will reasonably want to verify the result on different subsets.
- The intended reader is also a likely reuser (e.g., a benchmark, an atlas).
Interactive figures still need a static fallback for the print PDF. Build the static version first, then layer interactivity on top — never the reverse.
- R primitives.
patchwork and cowplot snap individual ggplot2 panels into clean grids. Use patchwork::wrap_plots(..., widths = c(2, 1, 1)) to force the topic-sentence panel to dominate.
- Python primitives.
matplotlib.gridspec plus seaborn.FacetGrid. Define a GridSpec(2, 4) and place each panel in named cells.
- Vector finishing. Adobe Illustrator is still the industry default for label alignment, exact-mm sizing, and PDF/EPS export. Inkscape is a real alternative if your institution will not pay the Illustrator tax.
- AI-assisted drafting. This is the new layer. Tools like Vizcept take a research outline and generate a panel-grid draft — schematic, axes, and sketch panels — at the exact 89 mm or 183 mm width. The output is editable SVG, not a screenshot, so the final figure is still your figure. The point is to skip the empty-canvas problem when you already know what story you want to tell.
Skip the empty-canvas problem on your next Nature submission.
Try Vizcept's Graphical Abstract Maker →
Paste your figure outline, pick an archetype, ship an exact-mm SVG in seconds.
The 7-minute pre-submission audit
Before the figure leaves your machine, run this pass. It catches roughly 80% of the issues above.
- Minute 1 — write the caption from memory. If you cannot, the figure does not stand alone.
- Minute 2 — print at 100%. Read on paper, in landscape, at arm's length.
- Minute 3 — read panel labels left-to-right, top-to-bottom. Do they match the caption order?
- Minute 4 — squint. Do the colors still separate? Convert to grayscale in Preview/Acrobat and re-check.
- Minute 5 — measure the smallest text. Ruler on the printout. Below 5 pt? Rebuild at final size.
- Minute 6 — count units on every axis. Each axis label gets a unit or a clear unitless reason.
- Minute 7 — measure gutters. 4–6 mm. Tighten if loose.
If the audit takes longer than seven minutes, the figure has structural issues that will not be fixed by polish — return to the panel-as-sentence step.
What changes when AI helps
The bottleneck used to be the empty canvas: you knew what panels you needed, but converting a research outline into a 183 mm grid took a day of drag-and-drop. In 2026, AI-assisted figure tools collapse that day into minutes. The reasoning, the data, the story — those are still yours. The grid, the alignment, the exact-mm sizing — those become the easy part.
The leverage is not "AI makes my figure for me." It is "AI clears the layout overhead so I can spend my hour on the part that determines whether the figure tells the story." That is the part editors and reviewers actually evaluate.
If you need a starting grid for your next Nature submission, open a fresh Vizcept canvas, paste your figure outline, and pick the archetype that matches your argument. The exact-width SVG ships in seconds; the rest of the day is yours to spend on the story.
")


")