Create Publication-Ready Bell Curves in Seconds
For statistics students, researchers, and analysts who need professional normal distribution graphs — without coding R or Python scripts.
Bell Curve Generator
Aspect ratio
Quality
Free trial: 5 credits, 2K resolution with watermark
Click an example to load its prompt
Examples
Turn Distribution Parameters Into a Bell Curve With AI
No coding. No statistical software.
Skip R, Python, and Excel. Describe your distribution parameters in plain language and get a professional bell curve graph back — ready for your paper, presentation, or exam.
Describe Your Distribution
Enter the mean, standard deviation, and what you want to highlight — confidence intervals, shaded regions, comparison curves, or grade distributions. Use natural language, not code.
AI Generates a Professional Graph
The AI plots an accurate normal distribution curve with proper axis scaling, labels, and shading. You get a statistically correct graph within seconds.
Download and Use Anywhere
Export as high-resolution PNG for slides and posters, or editable SVG for fine-tuning in Illustrator, Figma, or Inkscape. Paste directly into your report, thesis, or presentation.
One Bell Curve Generator, Three Workflows
Students · Researchers · Analysts
Whether you're studying for a stats exam, publishing a research paper, or running quality control in a factory — the same tool adapts to your needs.
Statistics Students
From STAT 101 to advanced methods
You need a bell curve for your homework or exam prep — but you don't want to learn R or Python just to make one graph. Describe what you need and get a textbook-quality normal distribution in seconds.
- Handles z-scores, percentiles, confidence intervals, and hypothesis testing regions
- Works at 11 PM before the deadline — results in under 30 seconds
- Free credits on sign-up — no payment info needed
Researchers
Publish faster, visualize clearly
Your paper needs a clean normal distribution figure that meets journal standards. Instead of wrestling with ggplot or matplotlib, describe your parameters and get a publication-ready figure — editable SVG included.
- Editable SVG output — adjust labels, colors, and layout in any vector editor
- 4K resolution for conference posters and large-format prints
- Consistent visual style across multiple figures in the same paper
Educators
Prep less, teach more
Stop building bell curve graphs by hand in Desmos or GeoGebra for every lesson. Describe the distribution once and get a clean, projector-ready graph with the shading and labels your students need.
- Generate bell curves with 68-95-99.7 rule shading for class handouts
- Create comparison graphs for control vs. treatment group discussions
- High-contrast output that reads clearly on classroom projectors
Generated by AI, Used in Real Work
Bell curve examples across disciplines
Every graph below was generated from a plain-text description. Click any example to load the same prompt and try it yourself.
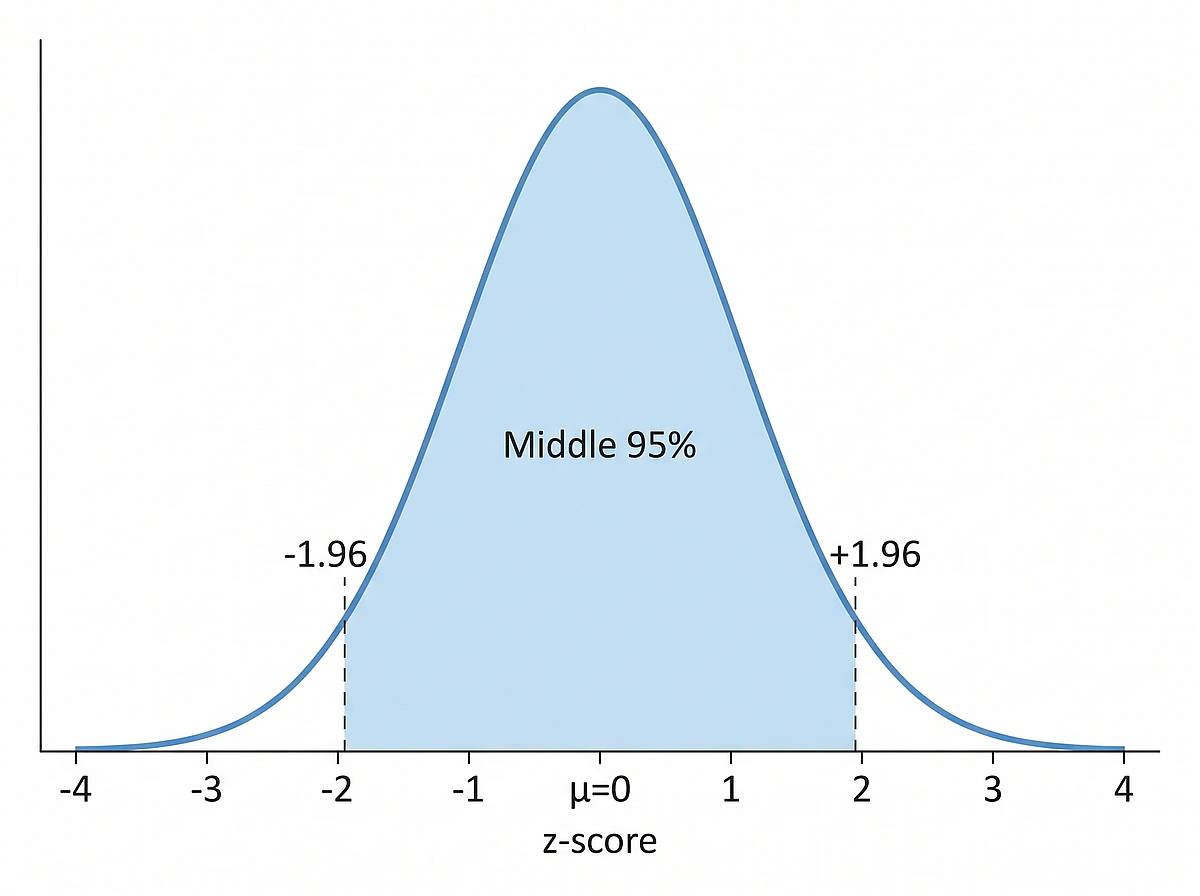
Standard Normal Distribution
z-scores with shaded confidence regions
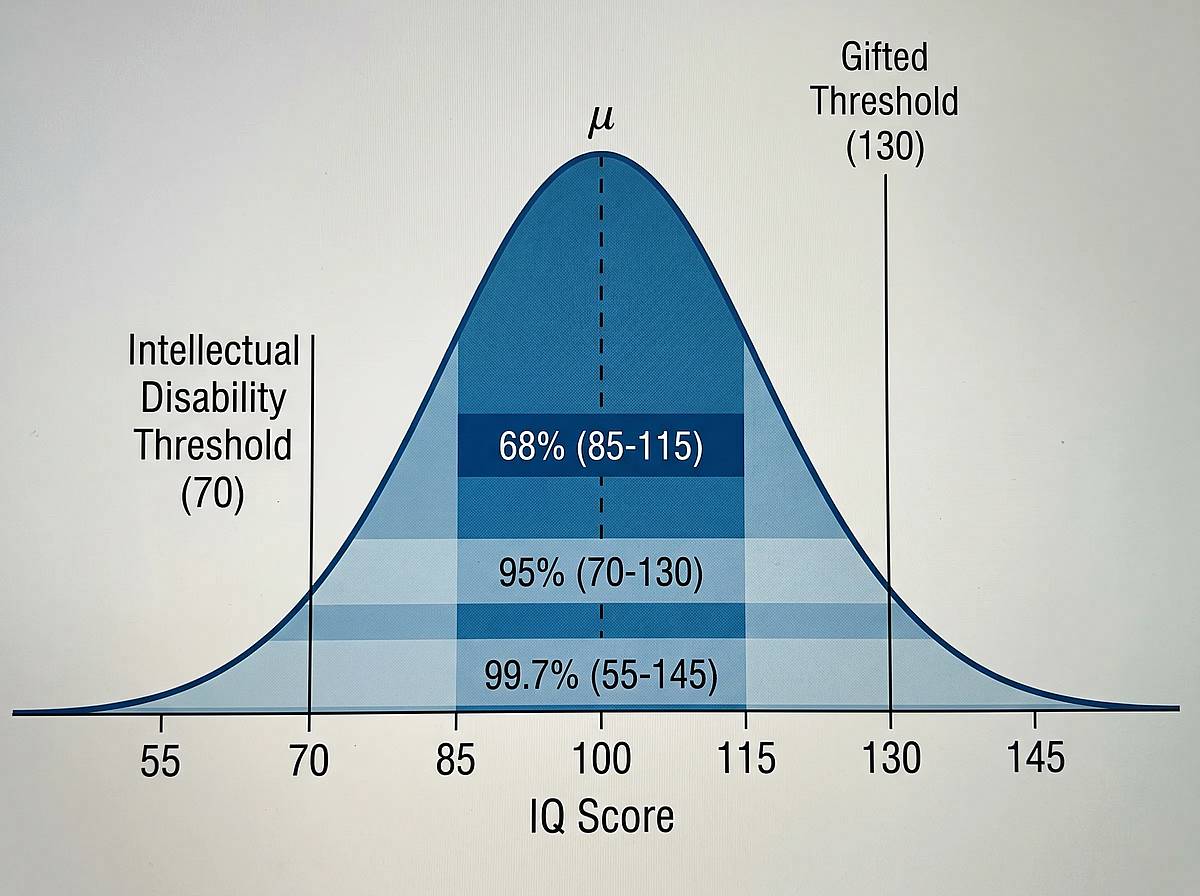
IQ Score Distribution
Percentile ranges and population labels
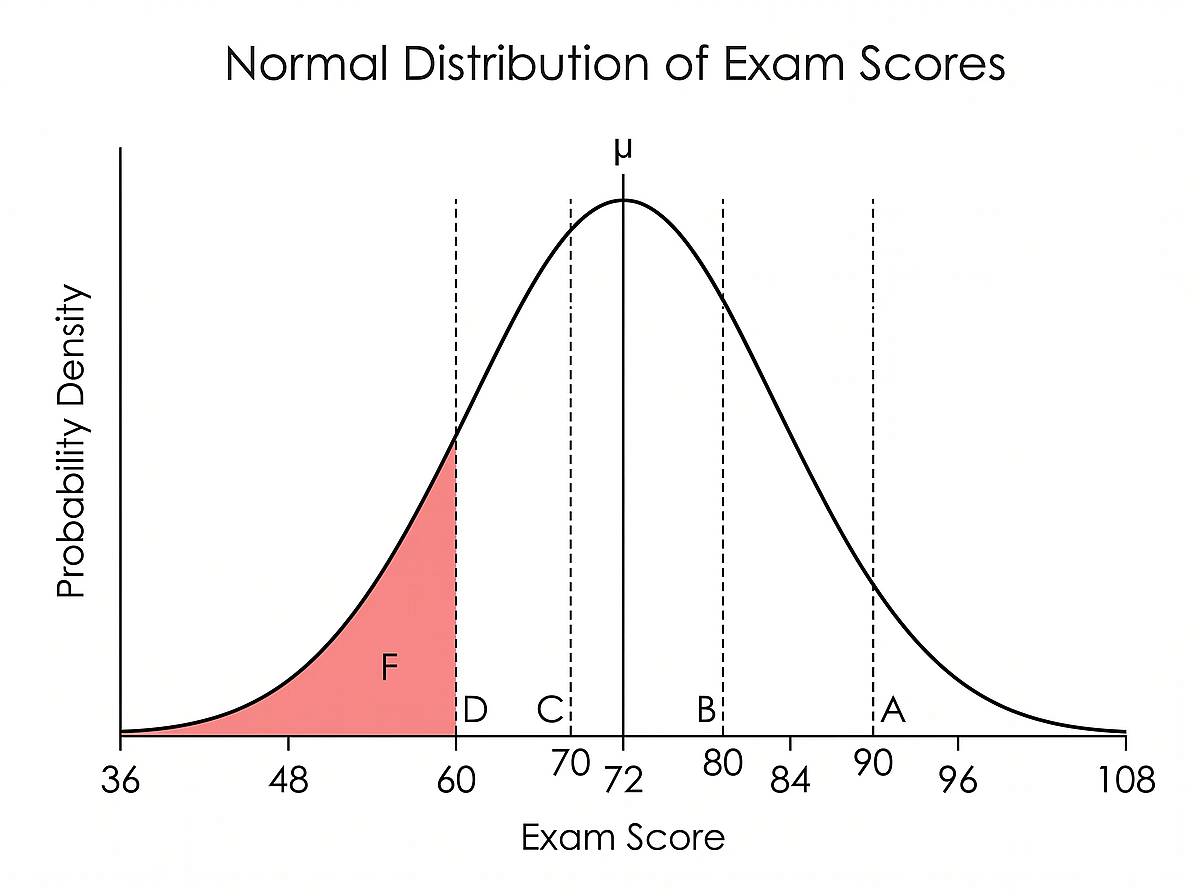
Exam Grade Distribution
Grade boundaries and letter grade regions
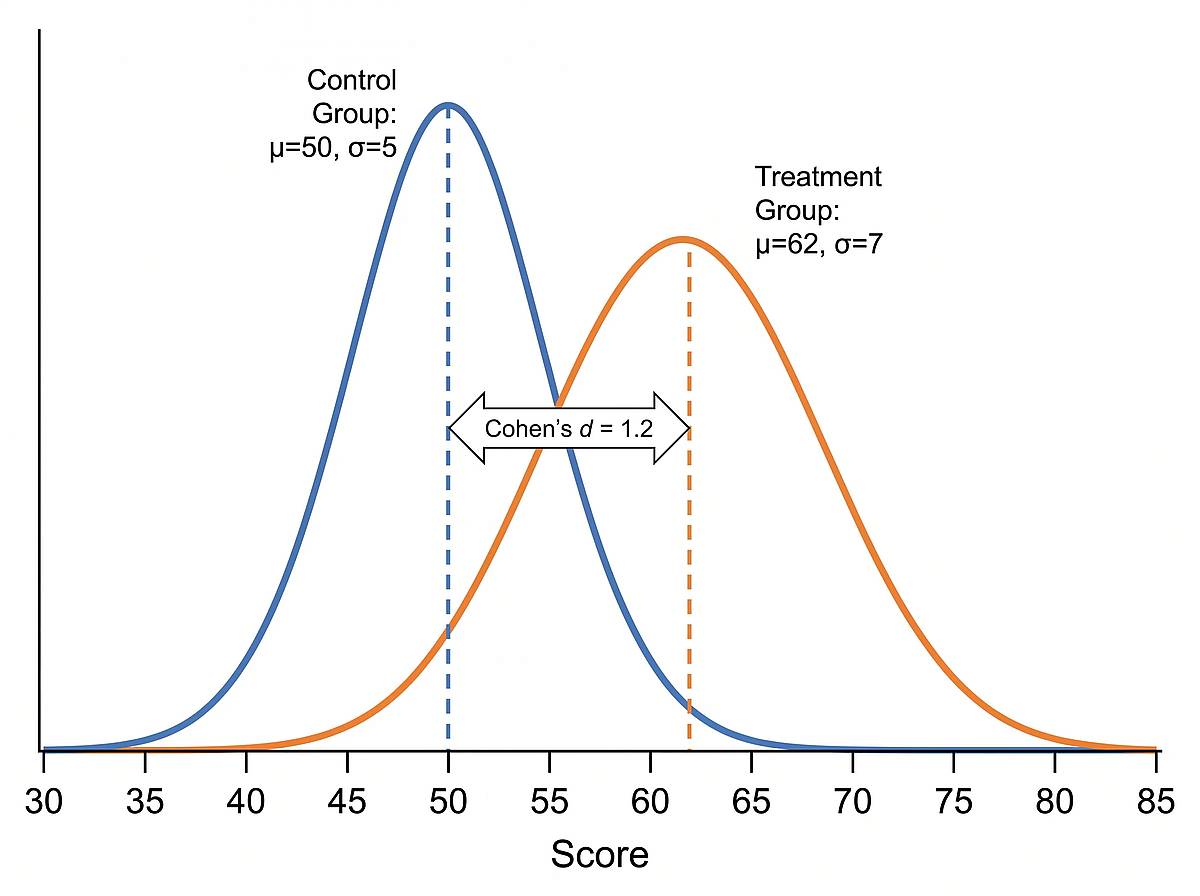
Two-Group Comparison
Control vs. treatment overlaid curves
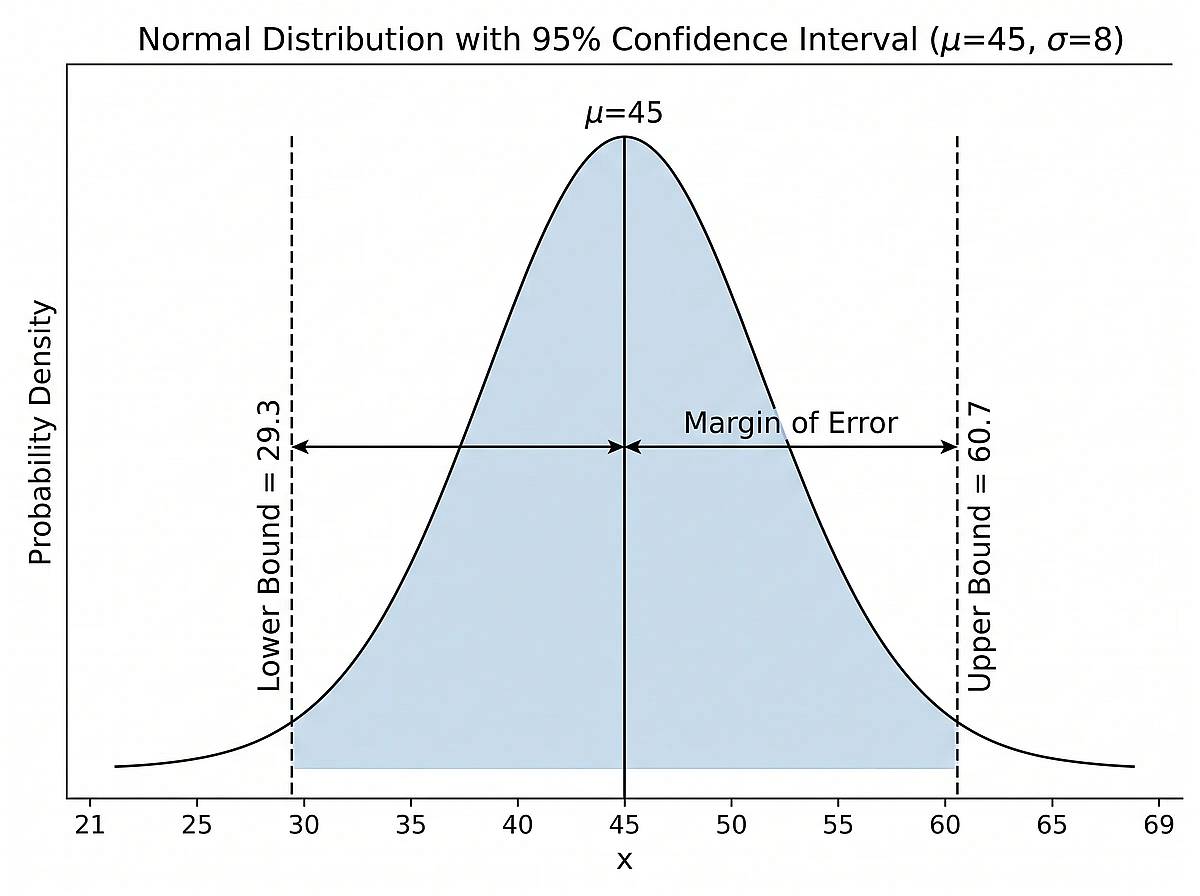
Confidence Interval Display
95% CI around the mean with error interpretation
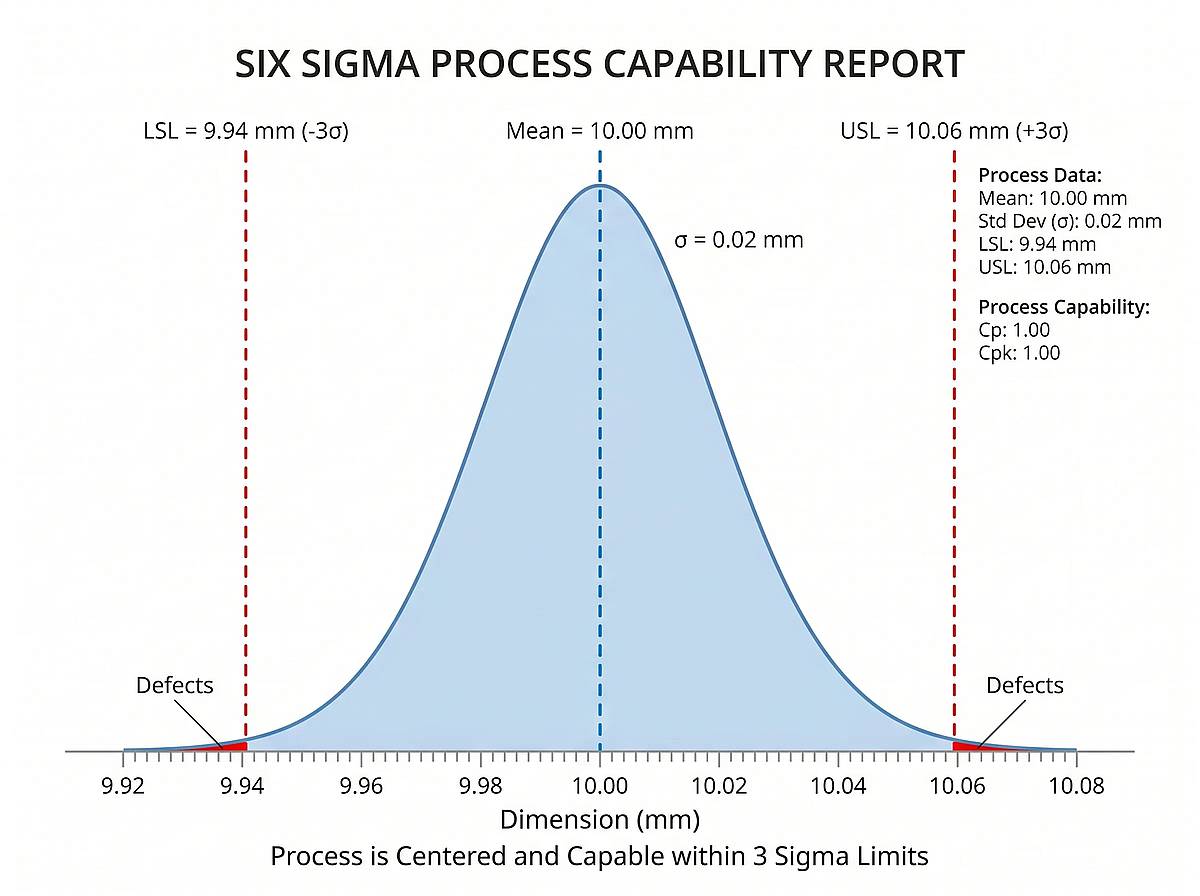
Six Sigma Quality Control
Specification limits and defect regions
What Makes This Bell Curve Generator Different
Not Another Graphing Calculator
Most bell curve tools make you enter parameters into rigid forms. This one reads your natural-language description — just like you'd explain it to a colleague.
Describe It, Don't Code It
Plain-Language Parameter Entry
Write 'IQ distribution with mean 100 and sd 15, shade top 2.5%' — the AI parses the parameters, calculates the thresholds, and plots an accurate curve. No programming, no spreadsheet formulas.
Start free, upgrade when you need more
Every account gets free credits on sign-up. Need more bell curves per month? Pick a plan that fits your workload.
Student or teacher? Apply for an education discount
How People Actually Use It
Real feedback from statistics students, researchers, and instructors who replaced manual graphing with AI.
Priya Nair
Statistics PhD Student, University of MichiganI needed five normal distribution figures for my dissertation chapter on hypothesis testing. Instead of writing ggplot scripts for two hours, I described each one here and had all five in under three minutes.
Dr. Marcus Webb
Assistant Professor of Psychology, UC DavisMy research methods students used to spend an entire lab session learning to plot bell curves in R. Now I point them here — they focus on interpreting the graphs instead of debugging code.
James Okonkwo
Quality Engineer, Automotive ManufacturingI use this for our weekly Six Sigma report. The specification limit shading and process capability labels are exactly what our plant manager expects. Way faster than Minitab for one-off graphs.
Bell Curve Generator — Common Questions
FAQ
Your First Bell Curve, Free
Describe any normal distribution. Get a professional bell curve graph in under 30 seconds. No coding, no Excel, no design skills.
Unlock all tools
One subscription unlocks every Vizcept AI diagram tool — from free body diagrams and syntax trees to biology diagrams and more.
Other tools you might like
Explore more AI diagram tools across subjects — from the same discipline and beyond.
 Popular
AI Diagram Maker
Describe any topic in plain English and get a publication-ready concept diagram in seconds.
 New
NewConceptual Framework Generator
Turn variables, mediators, moderators, and hypotheses into a labeled conceptual framework for thesis and journal research.
 New
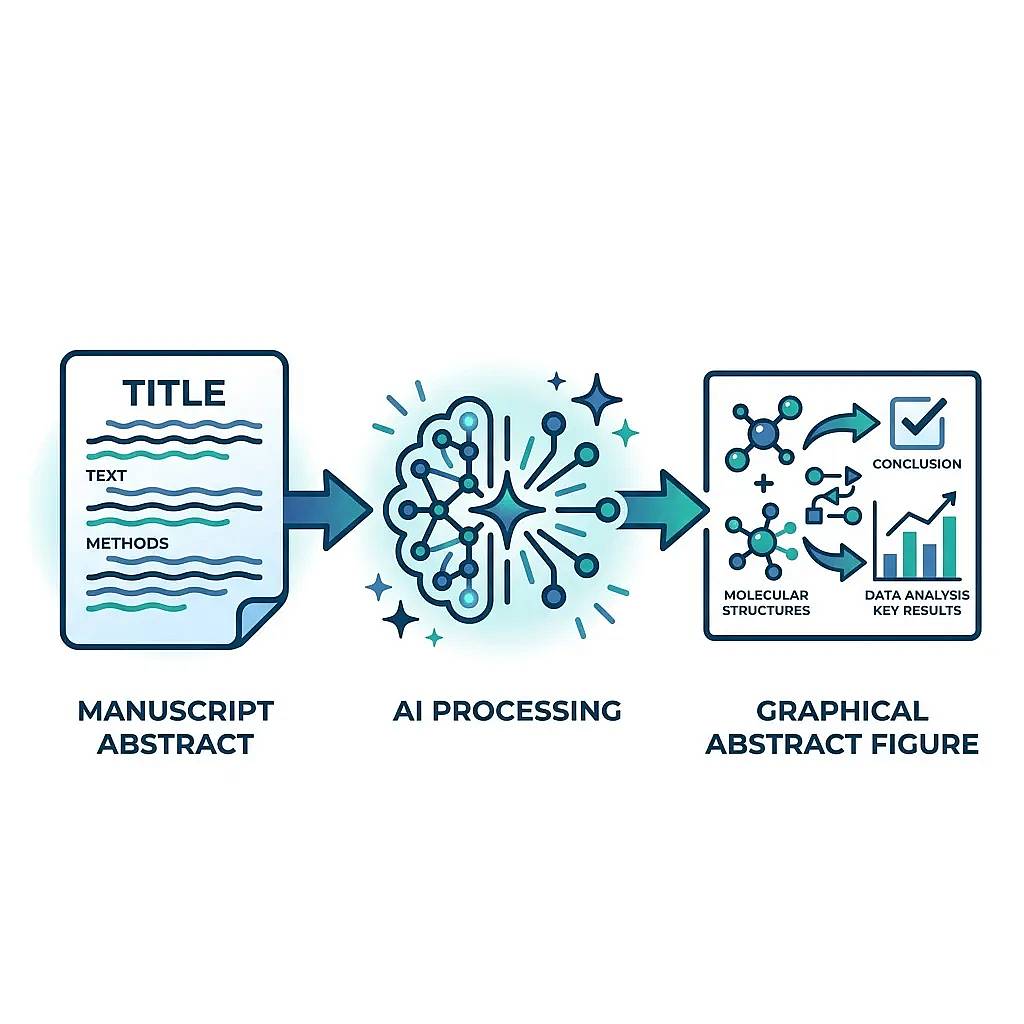
NewGraphical Abstract Maker
Paste your manuscript abstract — get a journal-ready graphical abstract in Elsevier, Cell Press, Wiley, or ACS dimensions in under a minute.
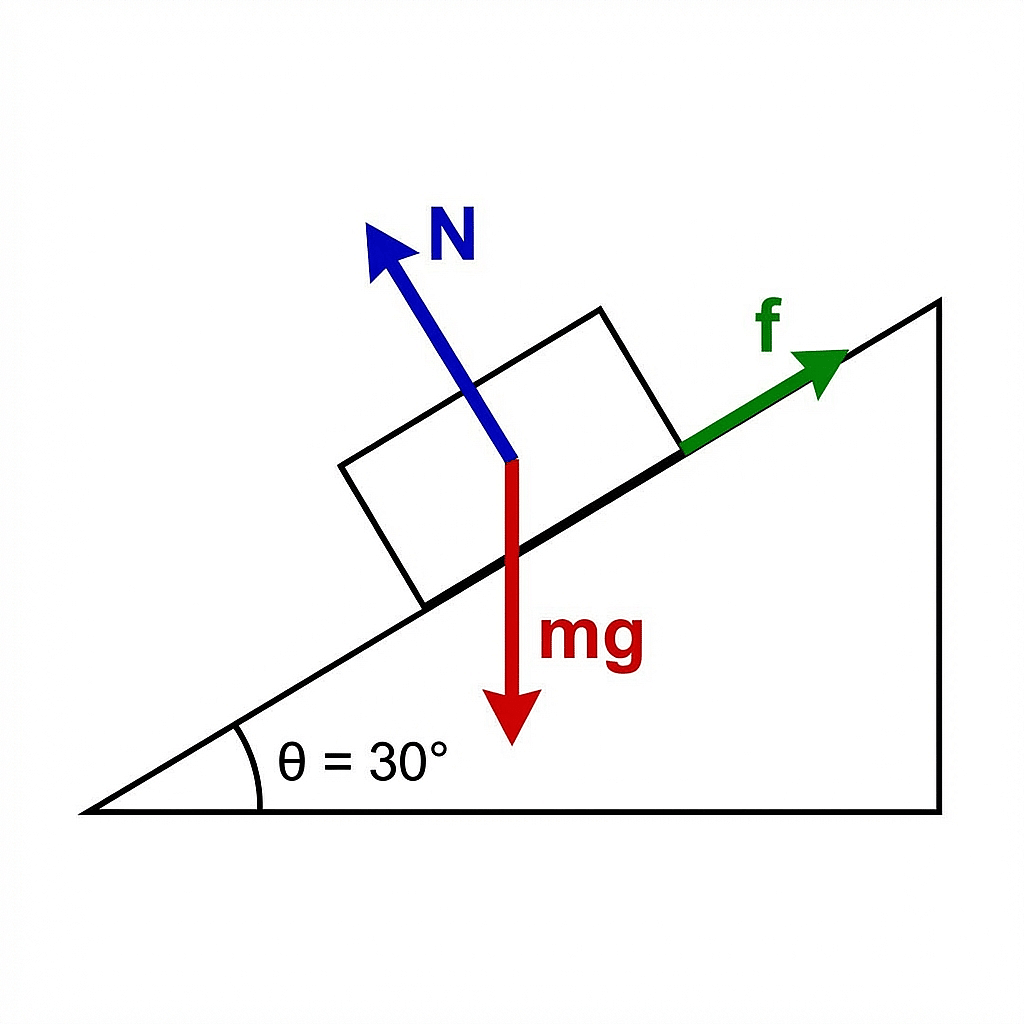
Free Body Diagram Maker
Turn physics problems into clean free body diagrams with forces, angles, and labels drawn for you.
 New
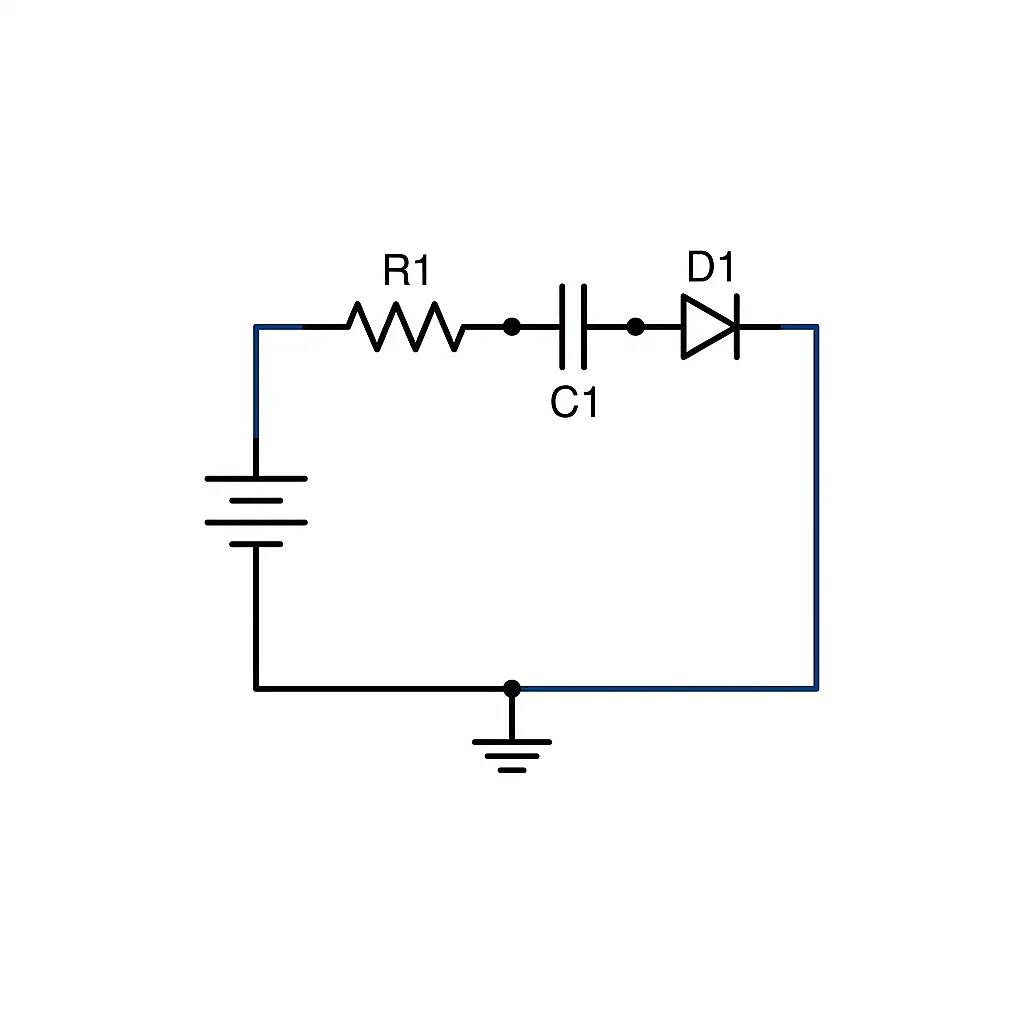
NewCircuit Diagram Maker
Describe components and connections in plain English and get a clean IEEE schematic for homework, lab reports, lectures, and build logs.
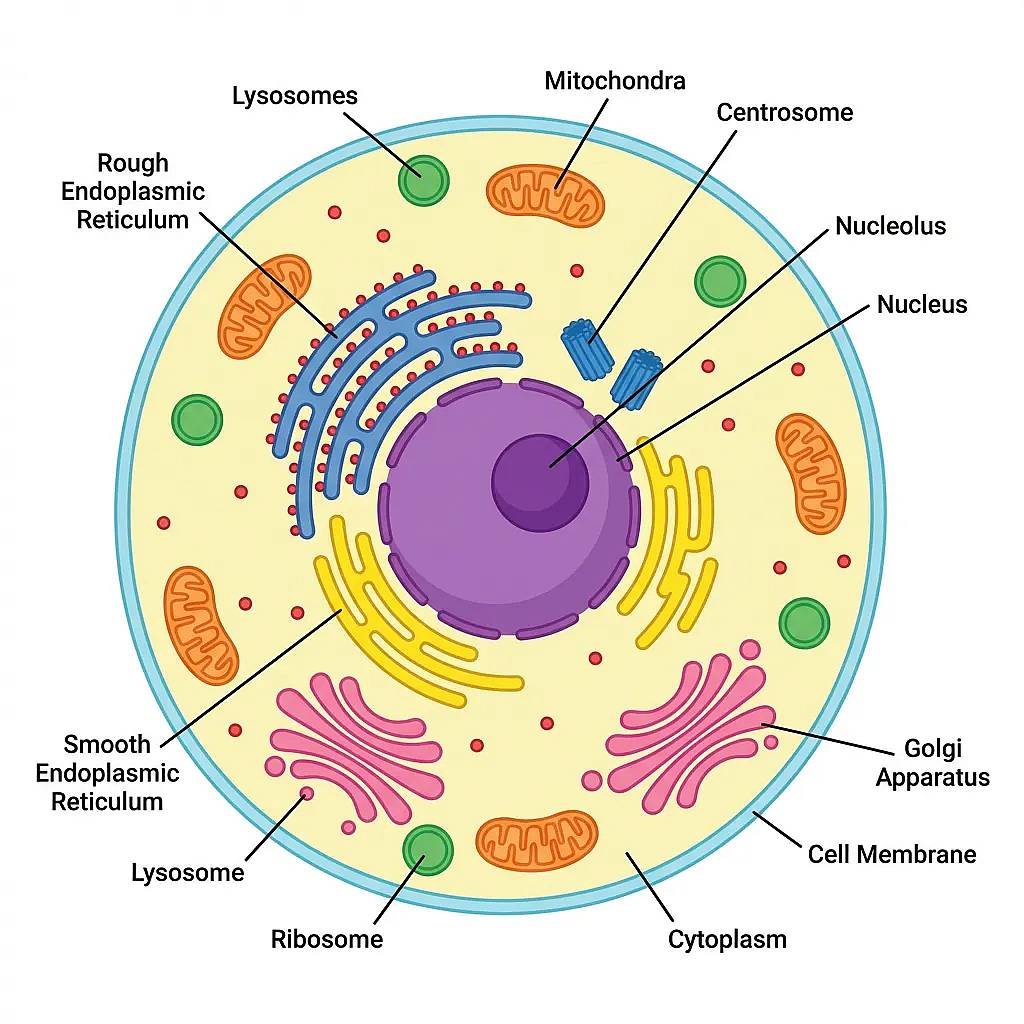
Animal Cell Diagram Generator
Generate labeled or blank animal cell diagrams for biology class, quizzes, and study guides.
 New
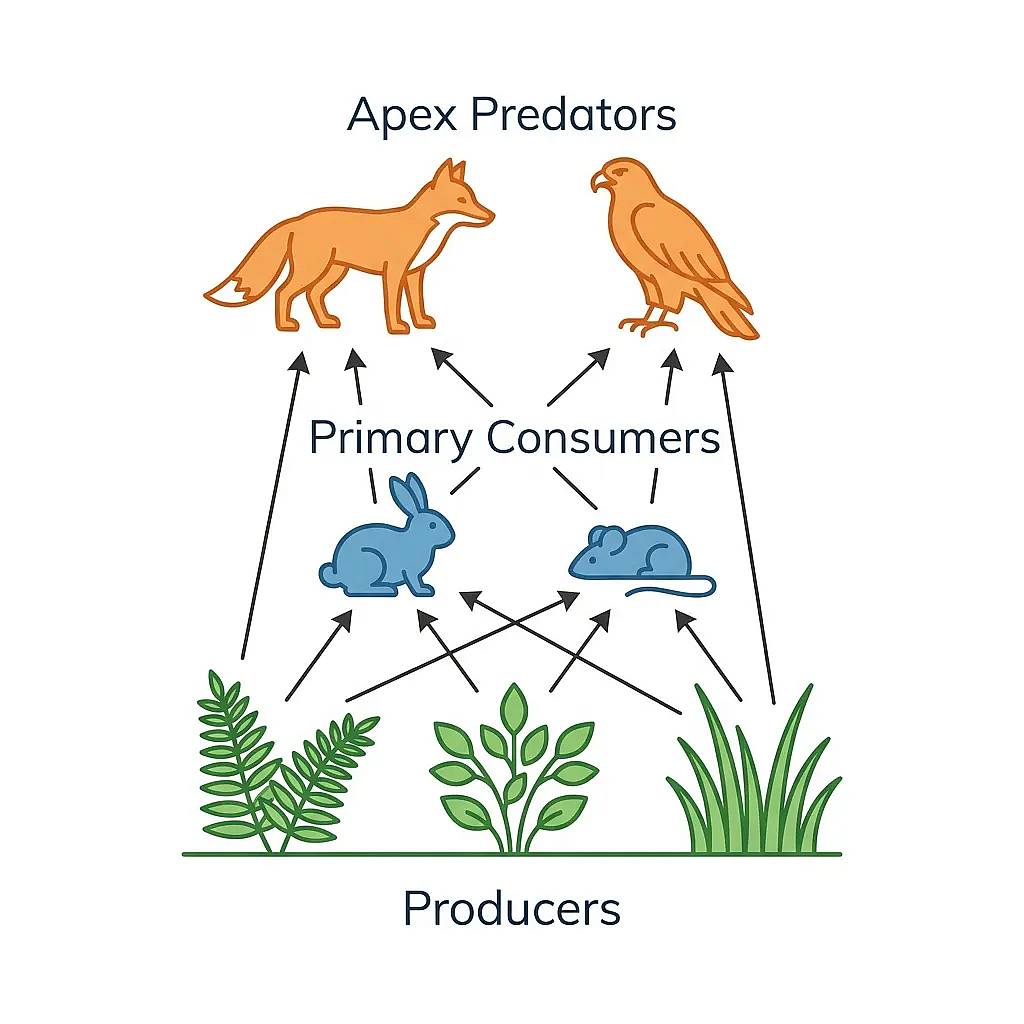
NewFood Web Maker
Create labeled food web diagrams for any ecosystem — ocean, forest, desert, freshwater, arctic, and more.
 New
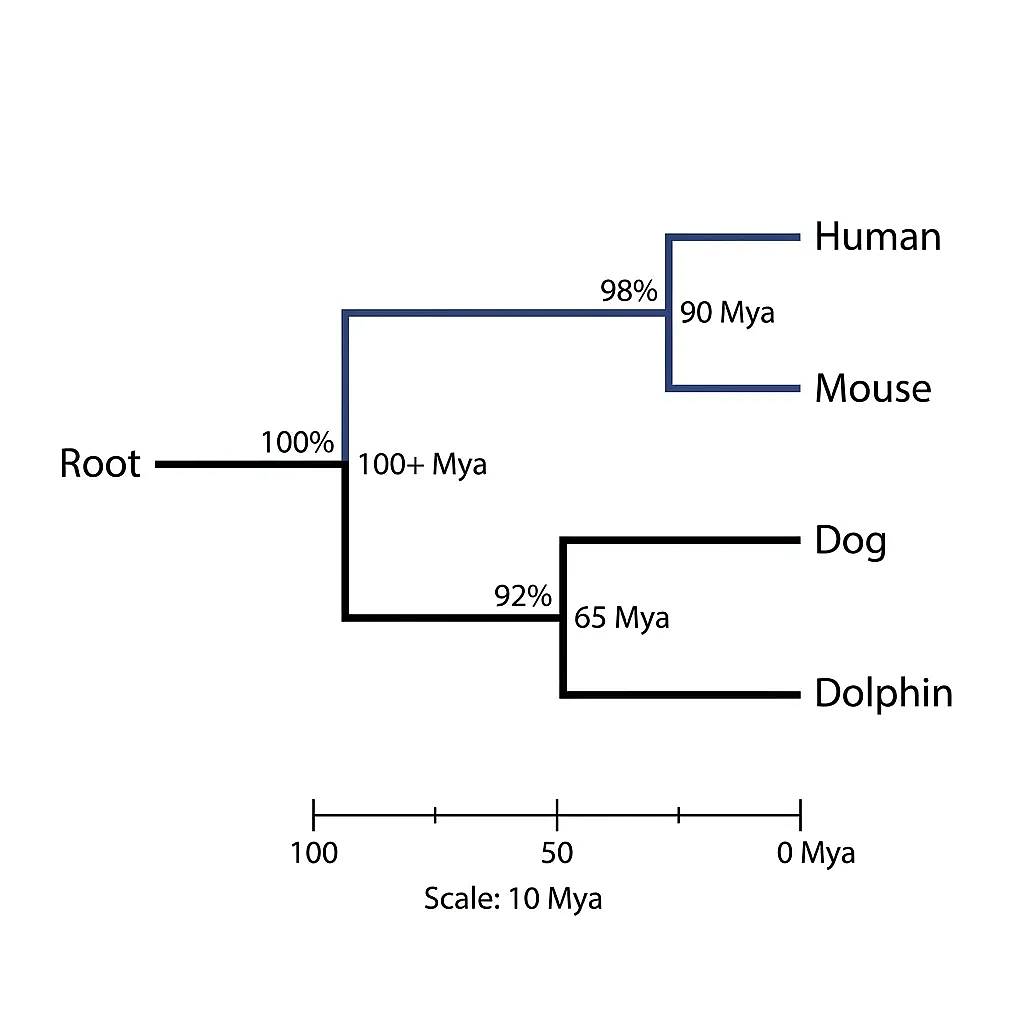
NewPhylogenetic Tree Maker
Describe taxa and their evolutionary relationships and get a labeled phylogenetic tree with branch lengths, bootstrap values, and rectangular, circular, or unrooted layouts.


