
IPO
Input–Process–Output Frameworks
Common in thesis programs
Describe the input, process and output columns and what goes in each, and the draft lays them out left to right. Check it as you would any figure.
A conceptual framework generator turns the variables and hypotheses in your study into a labeled diagram — independent and dependent variables, mediators, moderators and H1–Hn arrows. Vizcept reads the roles from your own wording and then places the boxes and arrows with code, so the construct names are typeset, not painted. Check the roles and arrow directions before you submit.
Describe your variables on the left to generate your own conceptual framework
Describe your independent, dependent, mediating and moderating variables in plain English, with your hypotheses. Vizcept lays out the model with labeled arrows; you check it against Chapter 2 and revise until your supervisor is happy.
List your constructs with their roles — independent, dependent, mediator, moderator, control — and your hypotheses, for example "H1: perceived usefulness positively predicts behavioral intention". Name the theory it builds on (TAM, TPB, RBV, SCT, UTAUT) if there is one.
Independent variables go on the left, dependent variables on the right, mediators between them and moderators pointing at the path they change, with H labels on the arrows. A text model reads the role of each construct and code places the boxes and arrows, so names are typeset, not painted. Check that each role and arrow direction matches your hypotheses.
Mark what to change on the figure, or edit your description and generate again; each version is kept so you can go back. Download PNG for Word or PowerPoint, or SVG for LaTeX documents and vector editors. Marking the figure sends it to an image model, which redraws the whole picture, so labels are painted and need checking again; to change a construct name, edit your description instead.
A conceptual framework is your study's model, usually drawn as a diagram: the variables you study, their roles (independent, dependent, mediator, moderator) and the relationship each hypothesis predicts. A theoretical framework is the published theory those relationships come from, such as TAM or the Theory of Planned Behavior.
| Theoretical framework | Conceptual framework | |
|---|---|---|
| What it is | An established theory from the literature | Your own model for this study |
| Built from | Published work, such as TAM or the Theory of Planned Behavior | Your research question and literature review |
| What it shows | The theory's constructs and propositions | Your variables, their roles and your hypotheses H1–Hn |
| What Vizcept draws | The base model, if you name the theory | The full diagram, from your description |
Build it from your research question and literature review, then draw it. Most thesis frameworks come together in five steps:
Choosing the variables and defending each arrow is your research; the generator draws and redraws the figure. For finished figures to copy the shape from, see conceptual framework examples by discipline.
Most committees expect these conventions. Describe each element's role and Vizcept follows them.
| Element | What it means | Where it goes | How it is drawn |
|---|---|---|---|
| Independent variable (IV) | The predictor you expect to influence the outcome | Left | Box, with arrows toward the dependent variable or mediator |
| Dependent variable (DV) | The outcome you measure | Right | Box that the arrows point into |
| Mediator | Explains how or why the IV affects the DV | Between the IV and the DV | IV → mediator → DV; add the direct IV → DV path if you test it |
| Moderator | Changes the strength or direction of the IV → DV link | Above or below the main path | An arrow pointing at the middle of the IV → DV arrow |
| Control variable | Held constant or measured so it does not confound the result | Near the DV | Dashed box or dashed arrow |
| Hypothesis | A testable prediction about one relationship | On the arrow it tests | H1, H2… with + or − for direction |
Input–Process–Output (IPO) frameworks, common in many thesis programs, work too: describe the three columns and what goes in each. A program logic model (inputs, activities, outputs, outcomes) is laid out the same way; see the logic model template and examples. Not sure whether a variable is a mediator or a moderator? See mediator vs moderator, with diagrams.
Your construct names are typeset from the analysis, so they are not misspelled — but the analysis itself can be wrong: a mediator read as a plain predictor, an arrow pointing the wrong way. A two-minute check catches it:
Found a mistake? Mark it on the figure and describe the fix; earlier versions stay in the Studio. How Vizcept draws figures explains why these checks matter. Once the figure passes, put it into Word, PowerPoint or LaTeX; if the comments come back anyway, turning supervisor comments into a revised figure sets out what each kind of comment is asking you to change.
Usually, if your university allows AI-assisted figures and you say so. Ask your supervisor, check your graduate school's guidance, add a figure note naming the tool, and keep your variable list as the source. Our guide to AI figures in journals and theses has an AI disclosure statement generator with a thesis option.
Writing a systematic review chapter as well? The PRISMA flow diagram generator draws the study-selection figure. And if you pay by credit pack, nothing renews after you submit — see how cancelling and credit packs work.
Graduate students · Researchers · Supervisors
Whether you're preparing a proposal defense, revising a manuscript or supervising a thesis, turn your variable list into a clear framework diagram — and keep revising it as the model changes.
Thesis and dissertation writers
Your variables and hypotheses are already in Chapter 2 — you need the diagram your supervisor keeps asking for. Generate a draft from your own wording, check it, and revise it version by version instead of fighting with SmartArt.
Journal authors and grant writers
Reviewers want a clear model figure and co-authors want to edit it. Generate the framework from your hypotheses, and regenerate when Reviewer 2 asks for another mediator.
Supervising thesis and capstone students
Teach your students what a conceptual framework should look like by running the conceptual framework maker on class exemplars. Show the difference between moderation and mediation with clean exemplar diagrams instead of chalk sketches.
Six models, ready to remix
Each example below was drawn from a plain-text description of variables and hypotheses. Use one as a template: click it to load the prompt, swap in your own constructs and hypotheses, then generate and check the labels.
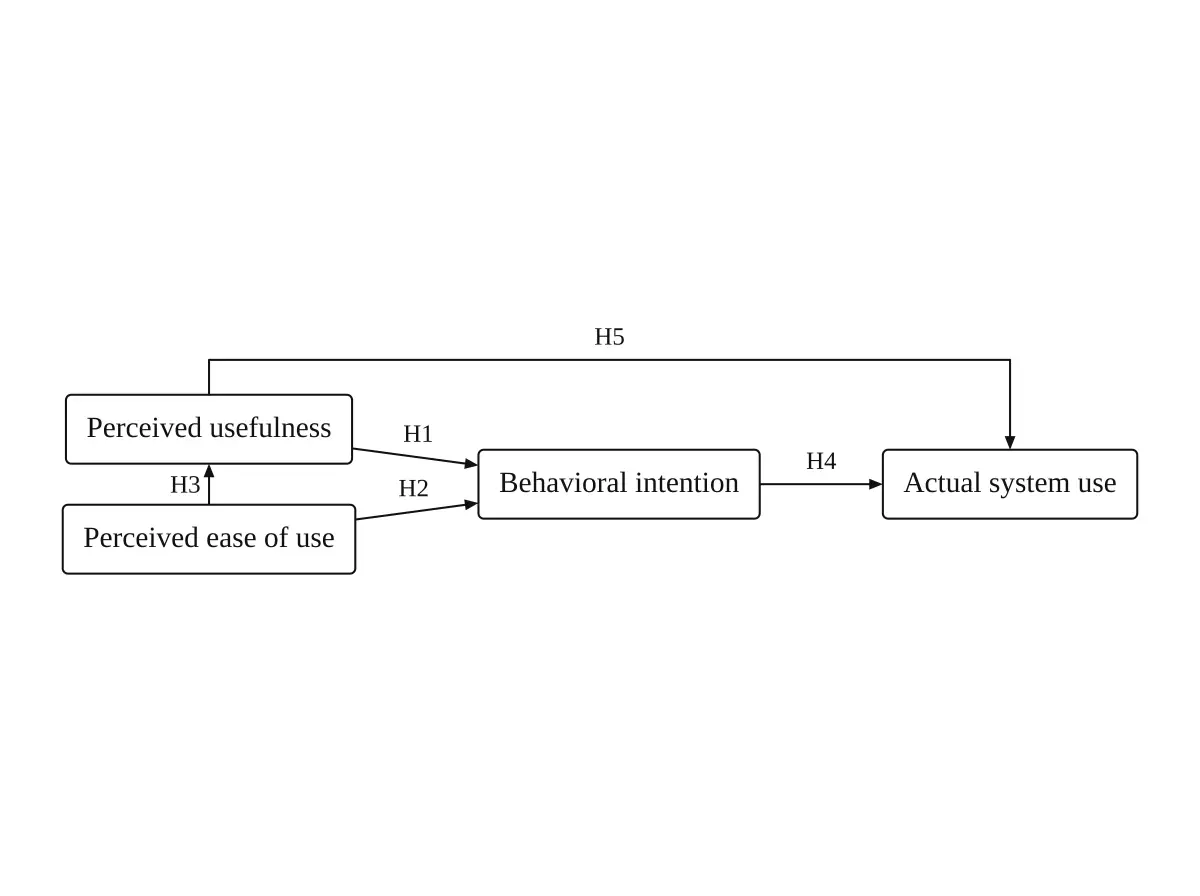
Perceived usefulness & ease of use → intention → use
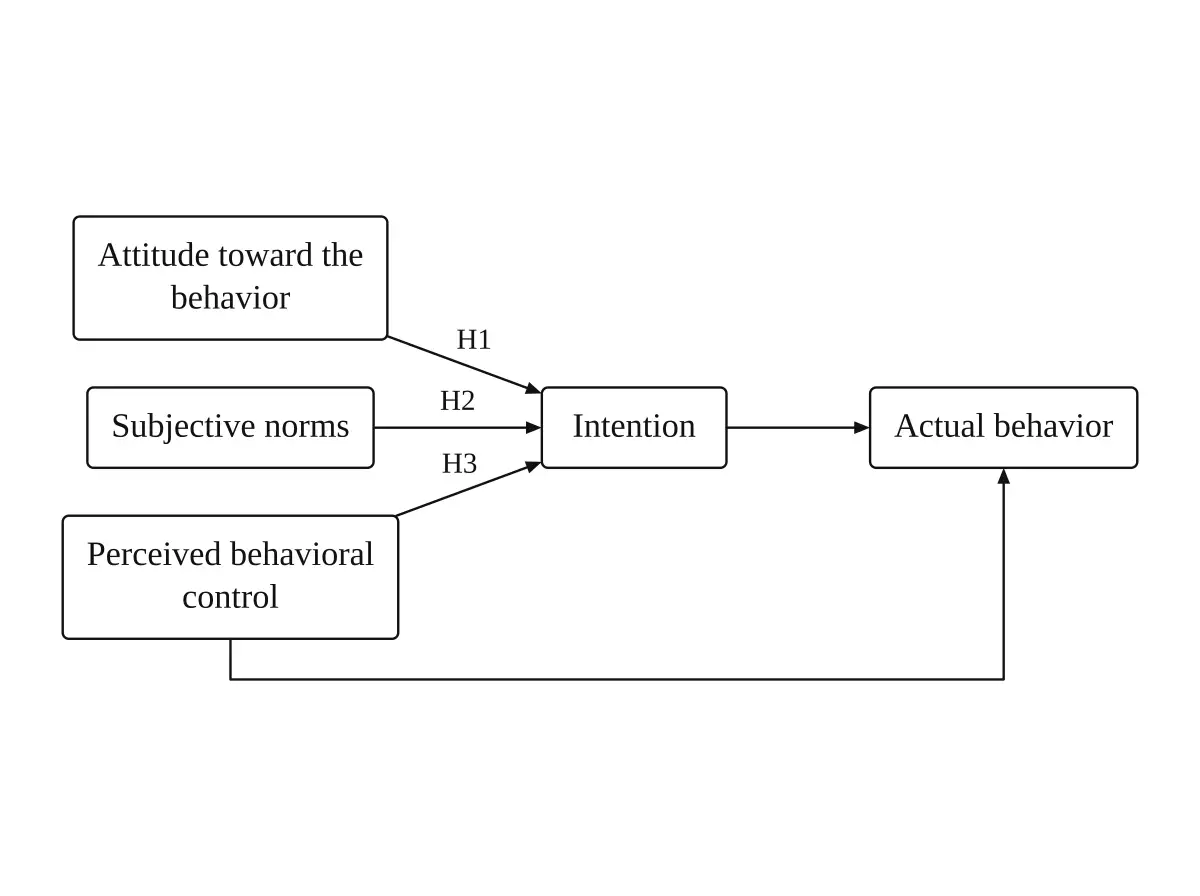
Attitude, norms, control → intention → behavior
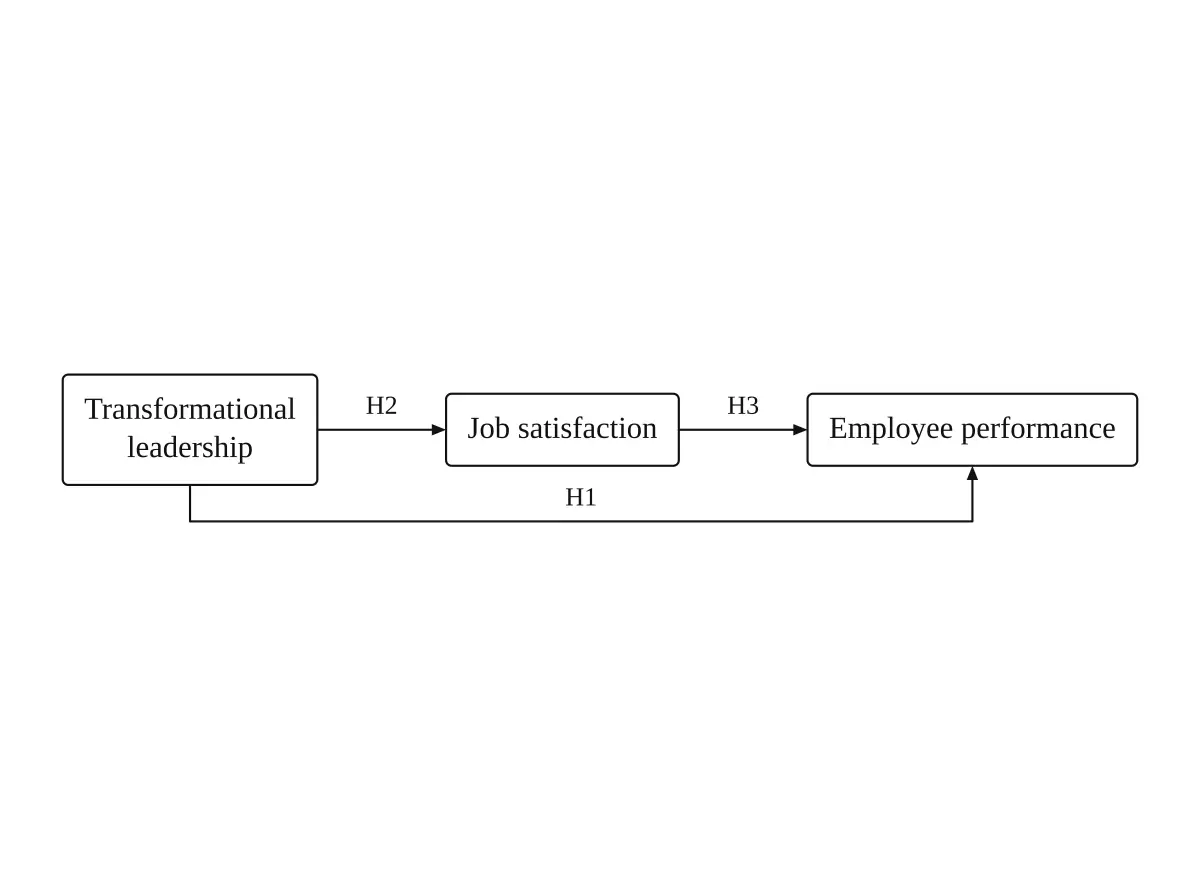
Transformational leadership → satisfaction → performance
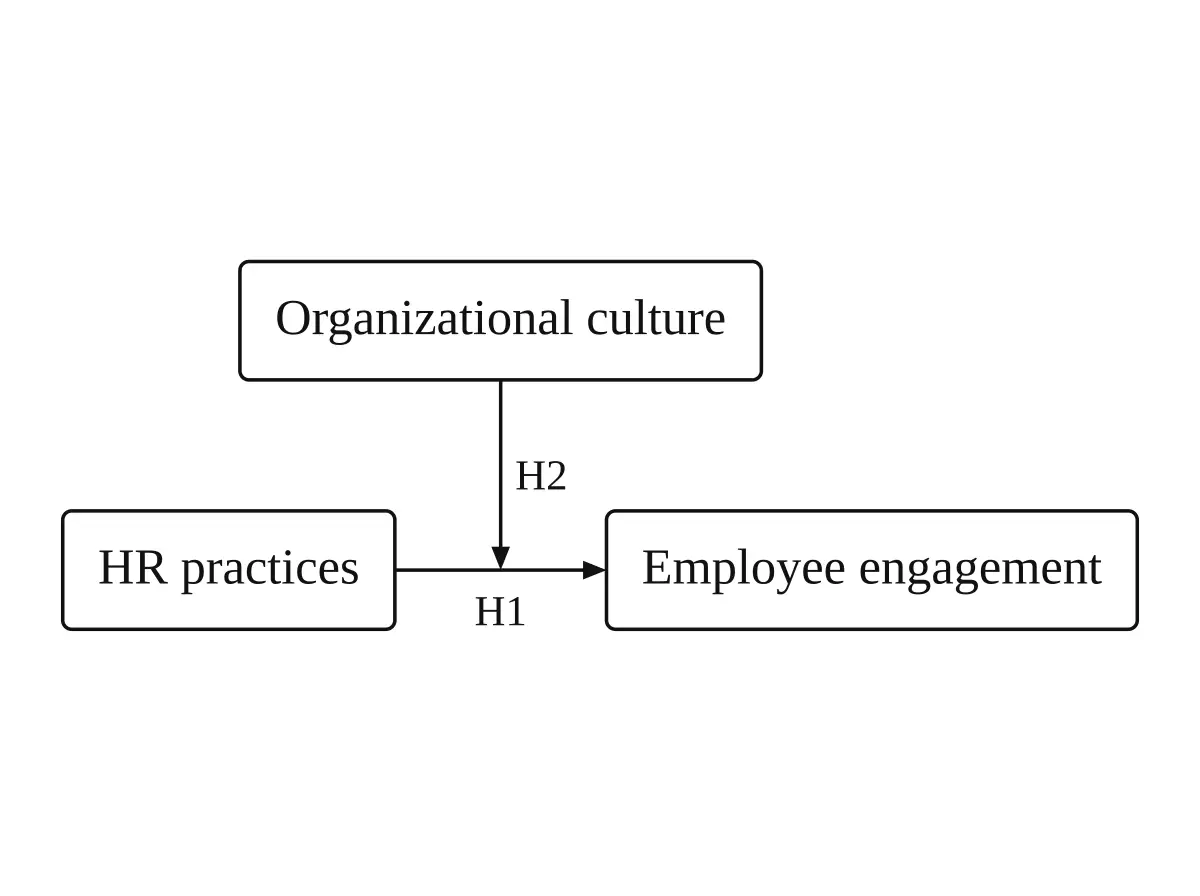
HR practices → engagement, moderated by culture
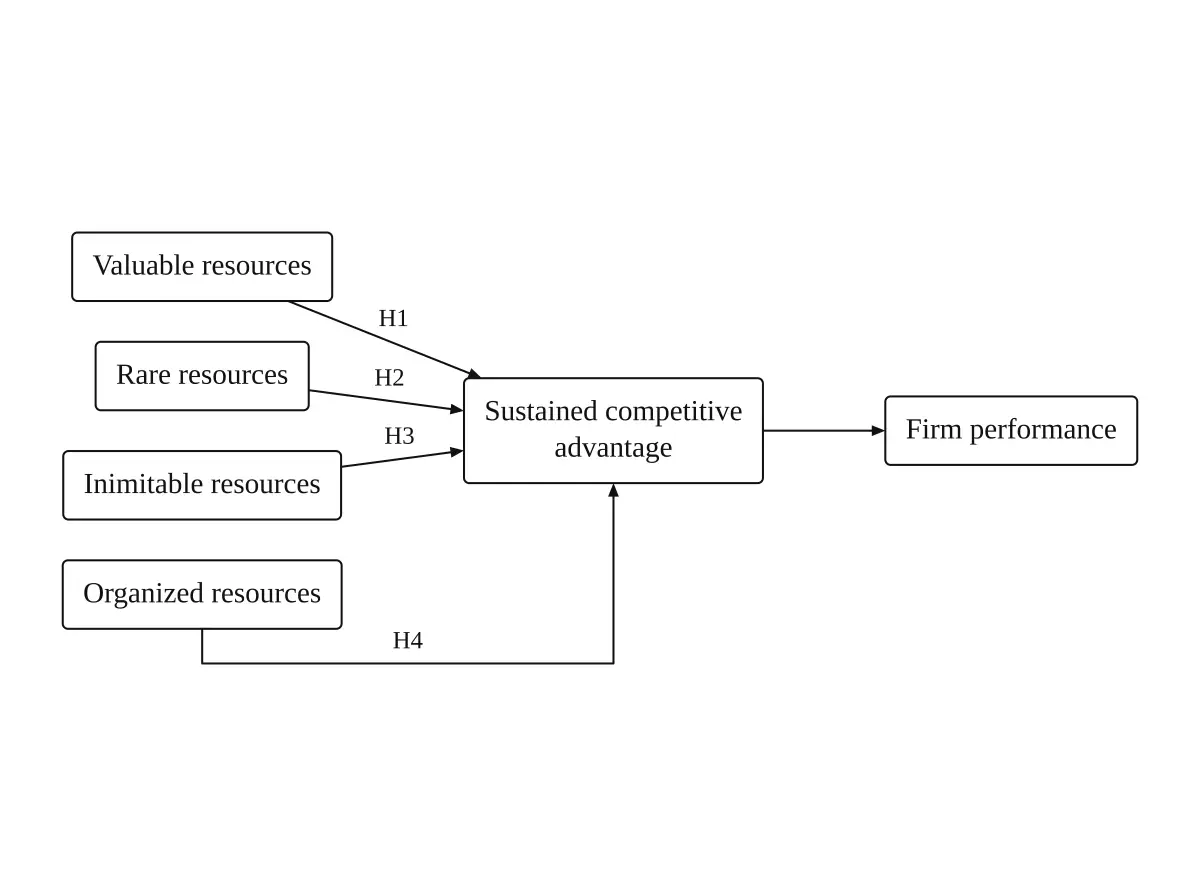
VRIO resources → competitive advantage → performance
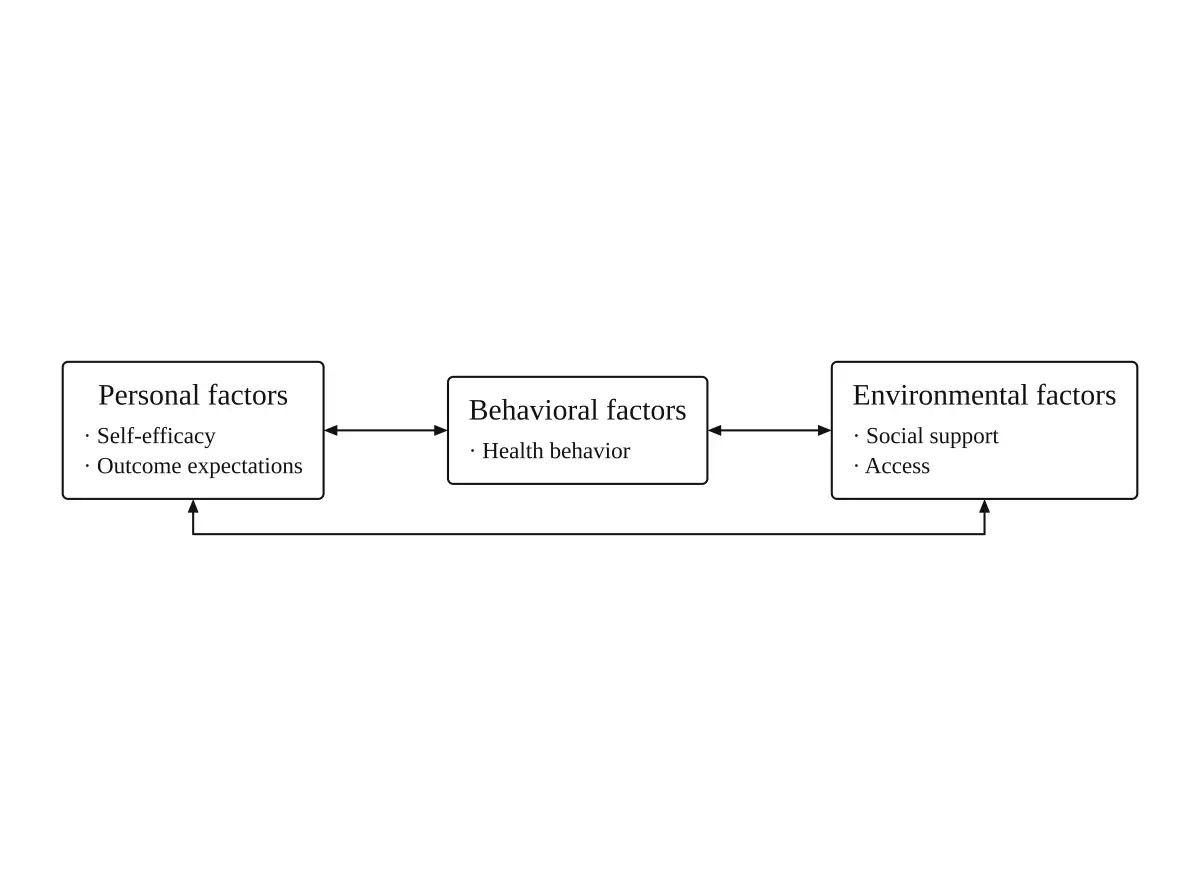
Personal, behavioral, environmental — reciprocal
Most diagram tools treat a conceptual framework as a flowchart. Vizcept builds research conventions into its instructions — where independent variables, mediators and moderators go, and how hypotheses are labeled — so the first draft starts close to what a committee expects.
Common in thesis programs
Describe the input, process and output columns and what goes in each, and the draft lays them out left to right. Check it as you would any figure.
H1, H2, H3 with direction
State your hypotheses and each one is labeled H1, H2, H3 on exactly one arrow, with + or − if you give a direction. The labels are typeset by code; what to check is that the model read each relationship the way you meant it.
Categories instead of hypotheses
For qualitative studies, describe your categories, sensitizing concepts and proposed links instead of hypotheses; the draft shows how the concepts relate.
Common theoretical foundations
Name a model such as the Technology Acceptance Model or the Theory of Planned Behavior and the draft starts from its standard constructs and paths. Add your own extensions without drawing from scratch.
Downloads for your manuscript
Export PNG (2K, or 4K on paid plans) for Word and PowerPoint, or SVG for vector editors. The SVG keeps real text, so a label stays a label you can restyle or retype. Writing in LaTeX? Open the SVG in Inkscape or Illustrator, save it as PDF and include that file.
Every version kept
Mark the change on the figure or edit your description and generate again. Every version stays in the Studio, so you can compare drafts or go back to the one your supervisor preferred.
Signed in, a framework typeset by code uses 2 credits; a marked-up edit, or a figure drawn by the image model, uses 5 at 2K. Frameworks get revised a lot: paying thesis writers on Vizcept have gone through 13 to 24 versions of a single framework. A 150-credit pack ($19.90) covers 75 code-typeset frameworks, or 30 image-model figures at 2K; a 450-credit pack ($39.90) covers 225, or 90. Packs are one-time payments, valid 365 days, and never renew. Every account gets free credits on sign-up, and monthly plans start at $14.90 and can be cancelled any time.
Student or teacher? Apply for an education discount
Feedback from doctoral candidates, journal authors, and faculty advisors who stopped redrawing arrows in PowerPoint and stopped rebuilding frameworks from scratch for every revision. For many, this conceptual framework generator became their default figure-prep tool.
Dr. Priya Nair
Assistant Professor of Management, IIM BangaloreI had a mediation model with two mediators and a moderator on the second path. Drew it in minutes instead of wrestling with PowerPoint arrows the night before the journal resubmission deadline. The conceptual framework came out labeled with hypotheses exactly how the reviewer asked.
Marcus Chen
PhD Candidate, Information Systems, NUSMy TAM extension has four external variables feeding into perceived usefulness. My committee wanted a single-page framework figure. The conceptual framework maker drew it cleanly, labeled H1 through H7, and I passed proposal defense without redoing the diagram.
Dr. Ngozi Eze
Senior Lecturer, Health Psychology, University of Cape TownI teach Social Cognitive Theory every semester. I used to redraw the reciprocal triadic diagram for every lecture. Now I generate custom versions — personal, behavioral, environmental factors, all applied to whatever health topic we cover that week.
FAQ
Describe your variables, mediators, moderators and hypotheses. Get a draft framework to check and revise — no credit card, no drag-and-drop.
One subscription unlocks every Vizcept AI diagram tool — from free body diagrams and syntax trees to biology diagrams and more.
Explore more AI diagram tools across subjects — from the same discipline and beyond.
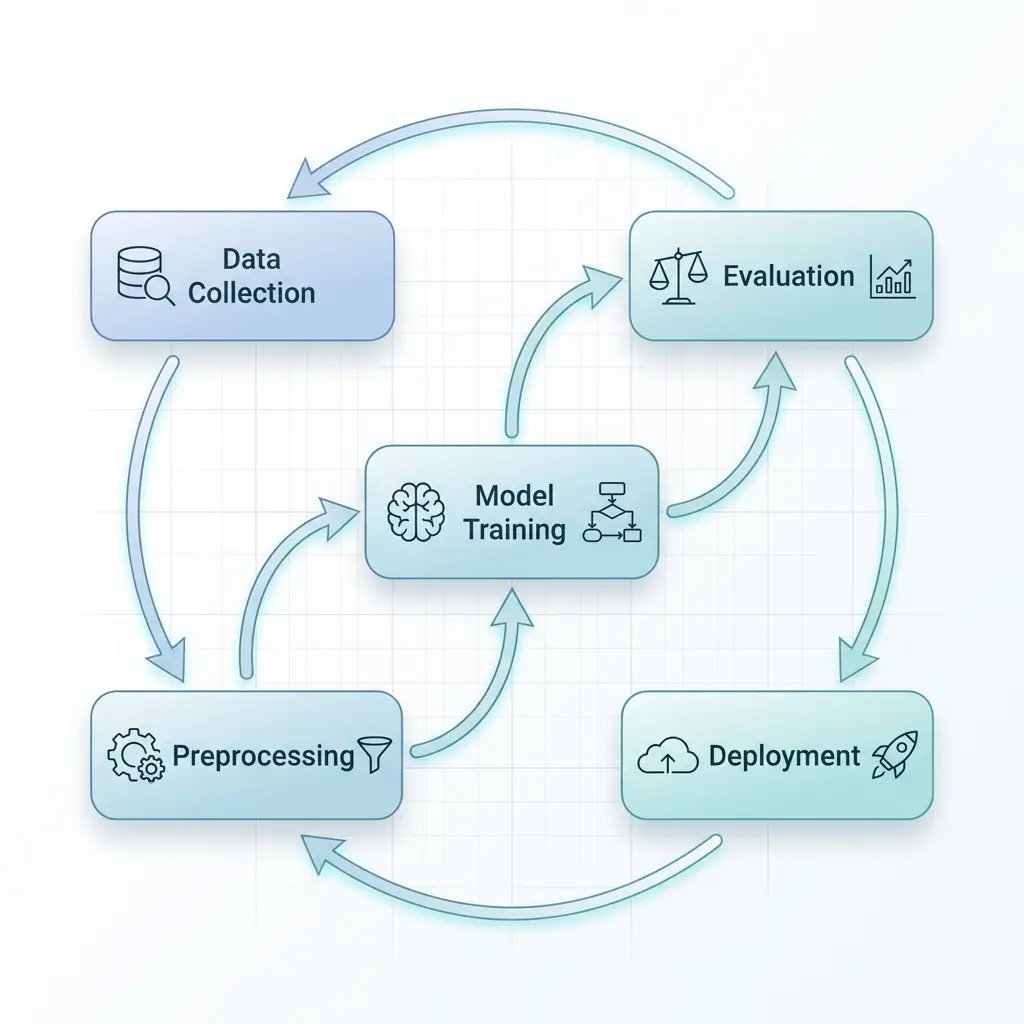 Popular
Describe any topic in plain English and get a publication-ready scientific diagram in seconds.
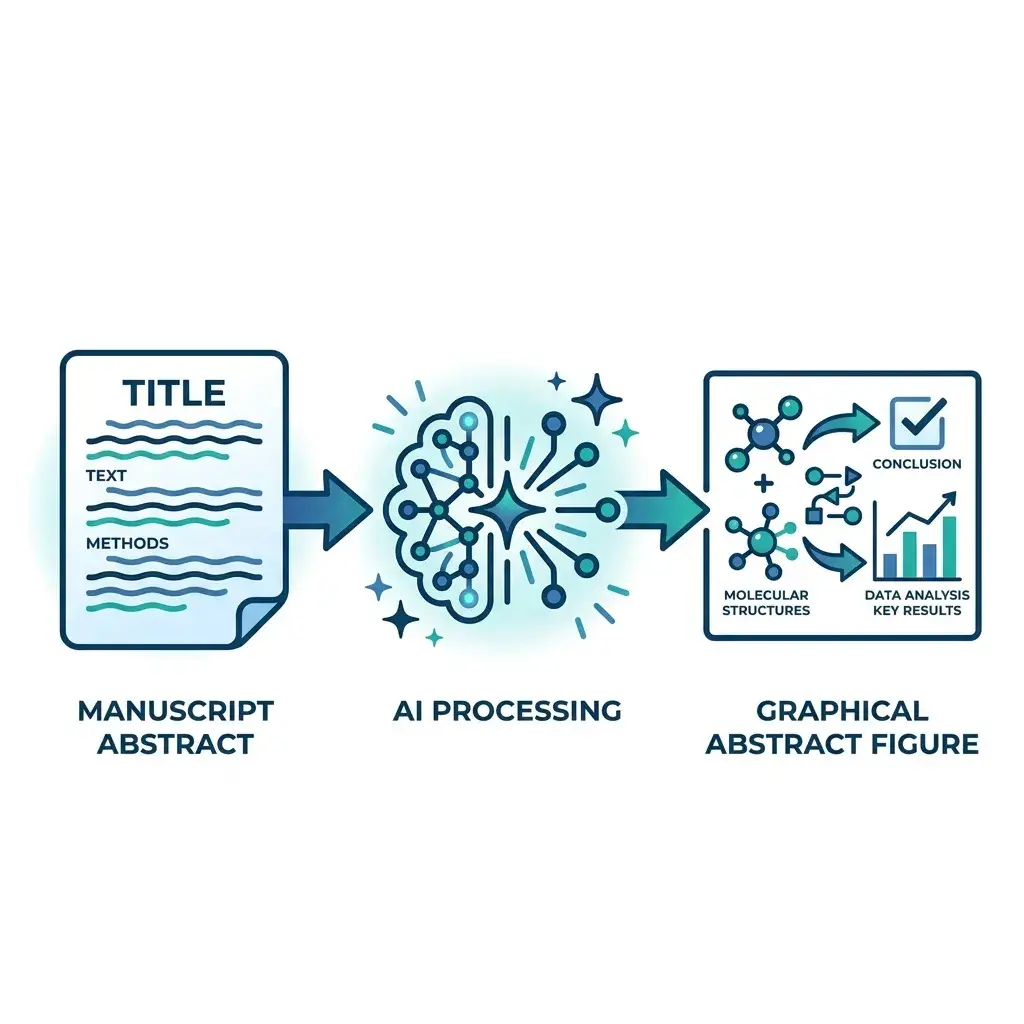 New
Paste your manuscript abstract — get a journal-ready graphical abstract in Elsevier, Cell Press, Wiley, or ACS dimensions in under a minute.
 New
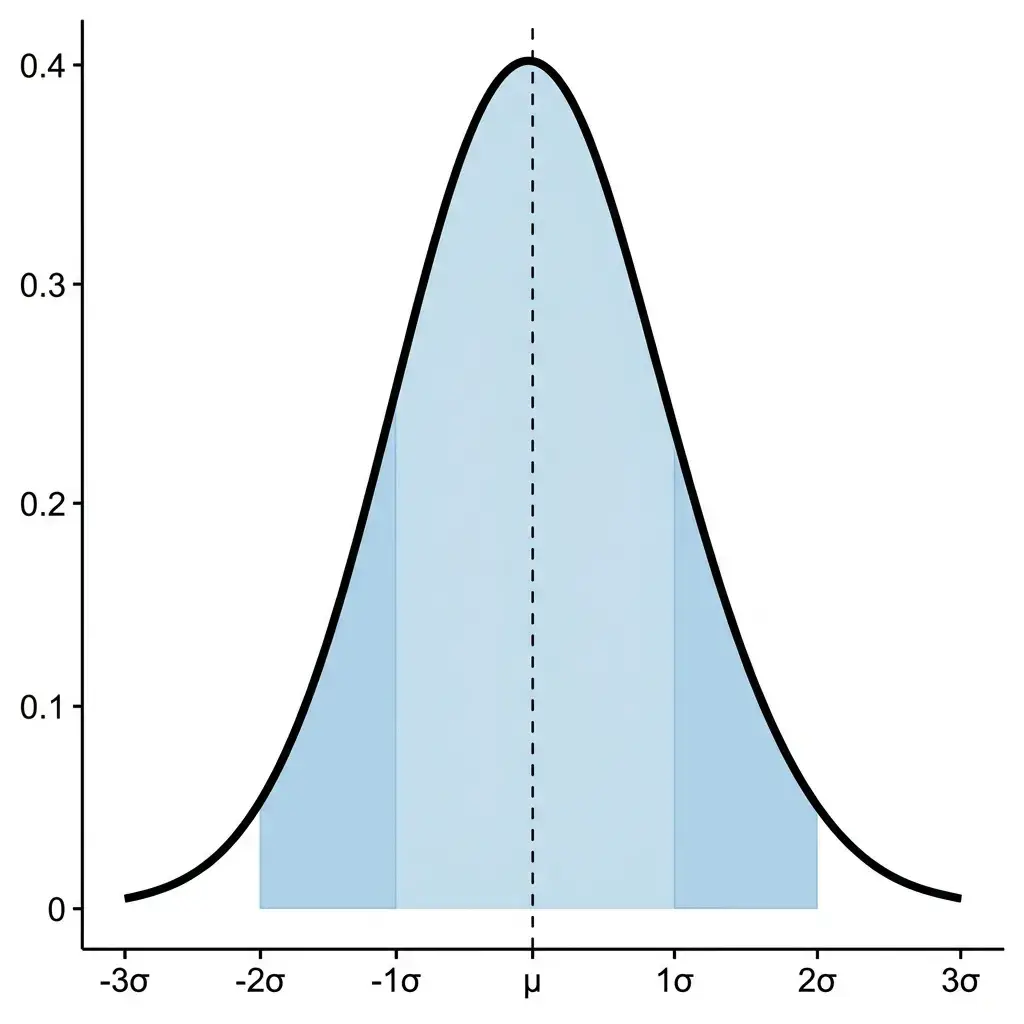
Type a mean and standard deviation, paste data, or set up a confidence interval or hypothesis test, and get an exact normal curve with the shaded area, its probability and the steps.
 New
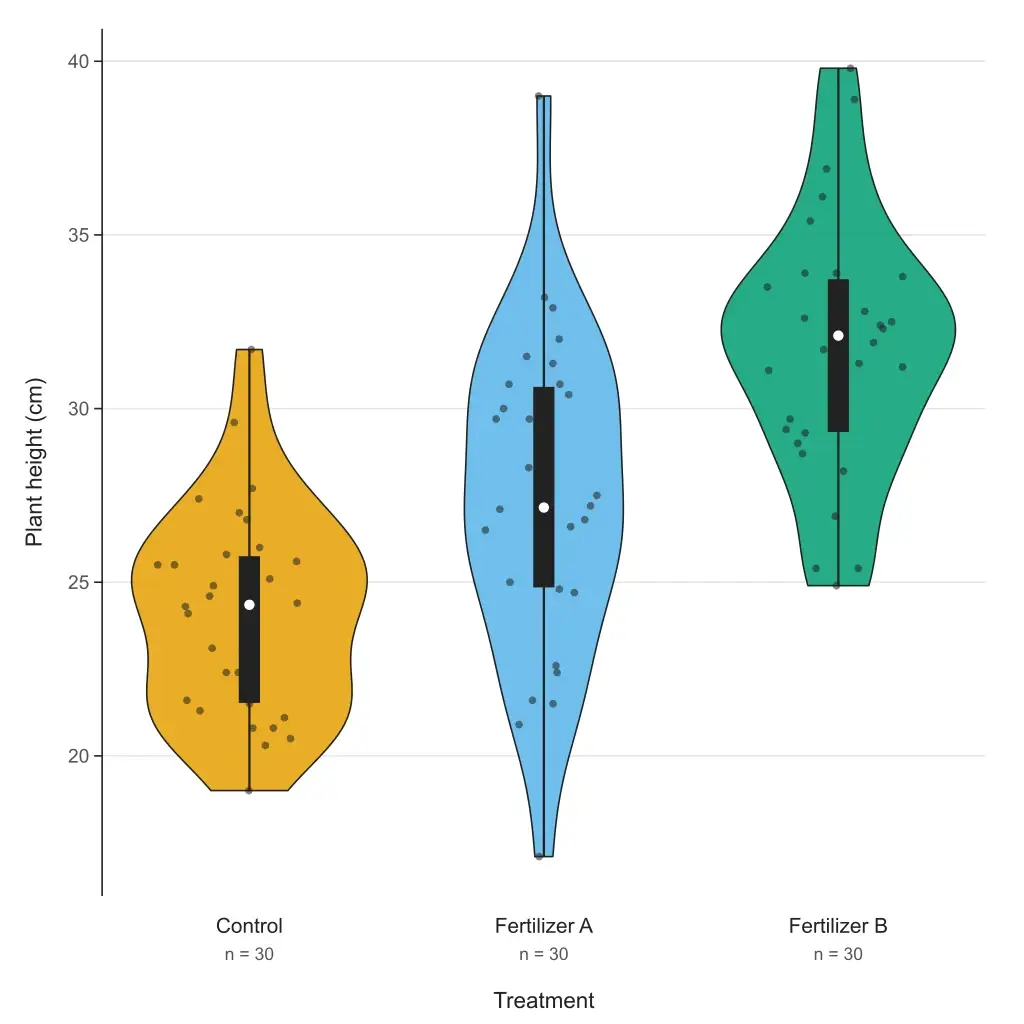
Paste your data and get a violin plot in your browser — grouped or single, box or quartiles inside, adjustable bandwidth, editable SVG and 300 DPI PNG. Free to paste and download; or describe your data and let AI fill it in.
 New
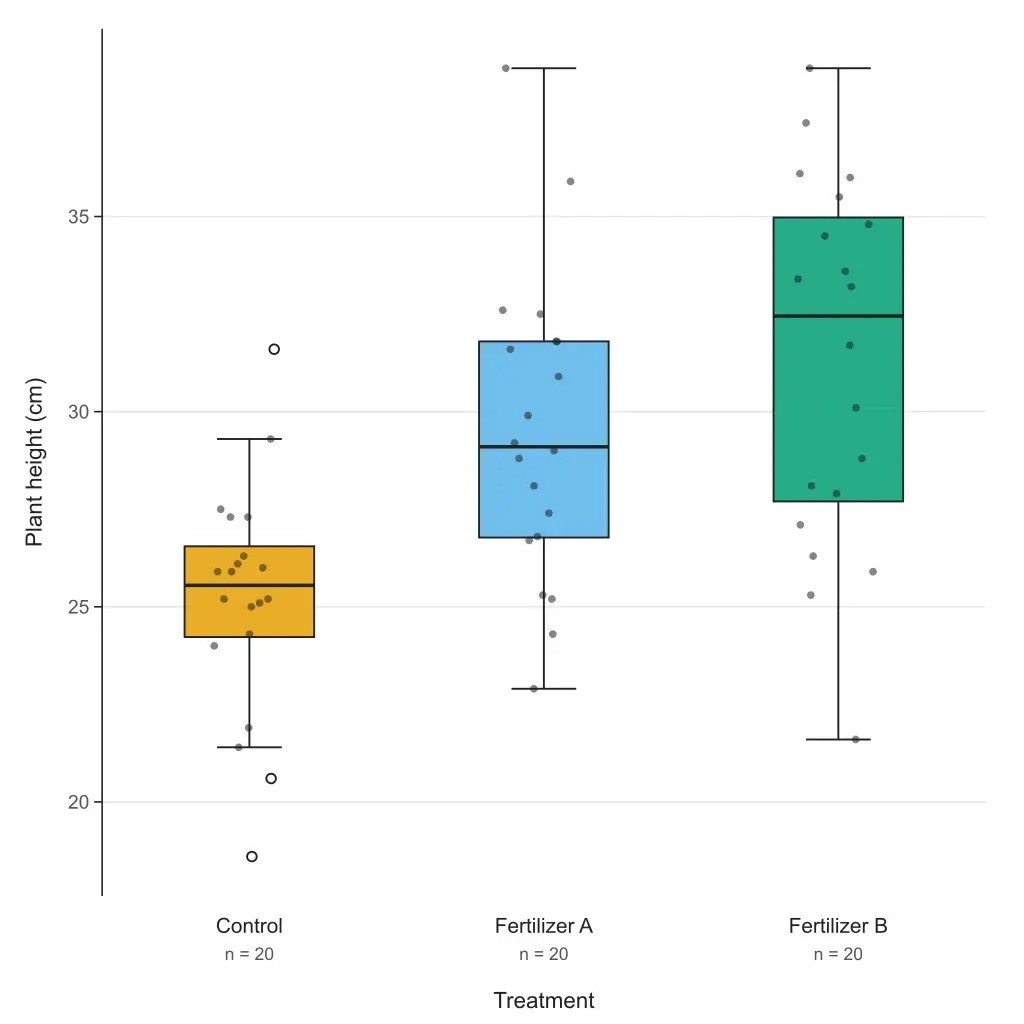
Paste your data or a five-number summary and get a box and whisker plot with quartiles, outliers and labels. Choose the TI-84, Excel or R quartile method; export editable SVG or 300 DPI PNG. Free to paste and download.
 New
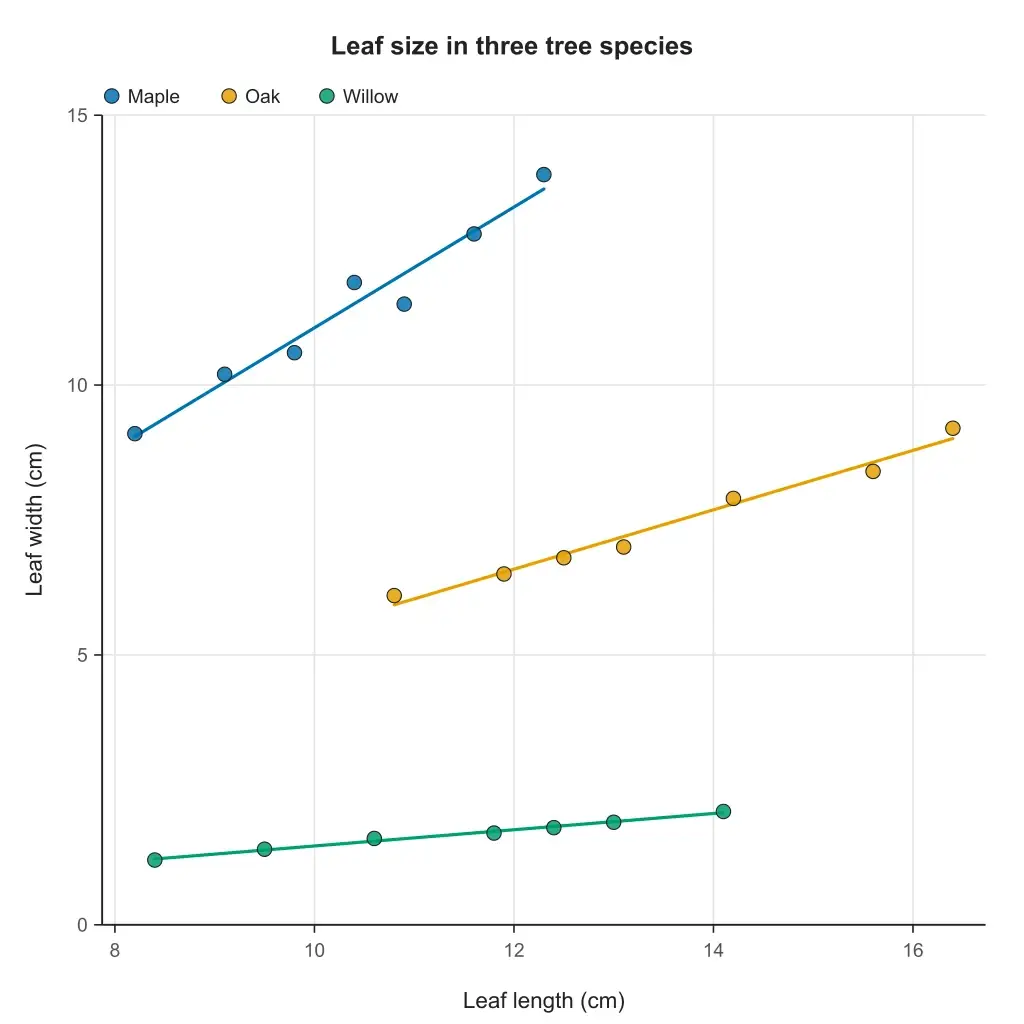
Paste two columns from Excel or a CSV and get a scatter plot with the line of best fit, its equation, r and R². Groups, point labels and step-by-step working; export editable SVG or 300 DPI PNG. Free to paste and download.
 New
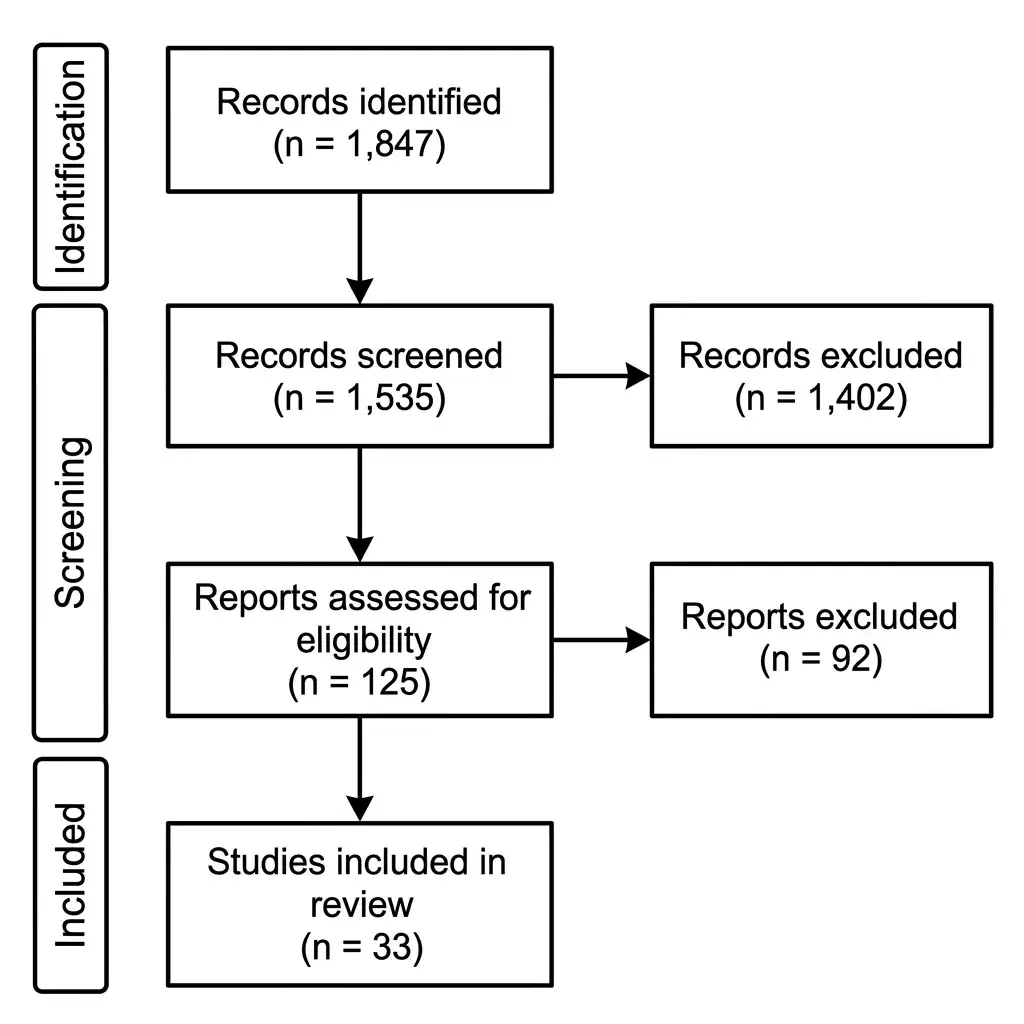
Turn your screening counts into a PRISMA 2020 flow diagram — three phases, exclusion boxes, and PNG 300 DPI or SVG export for systematic reviews and meta-analyses.
 New
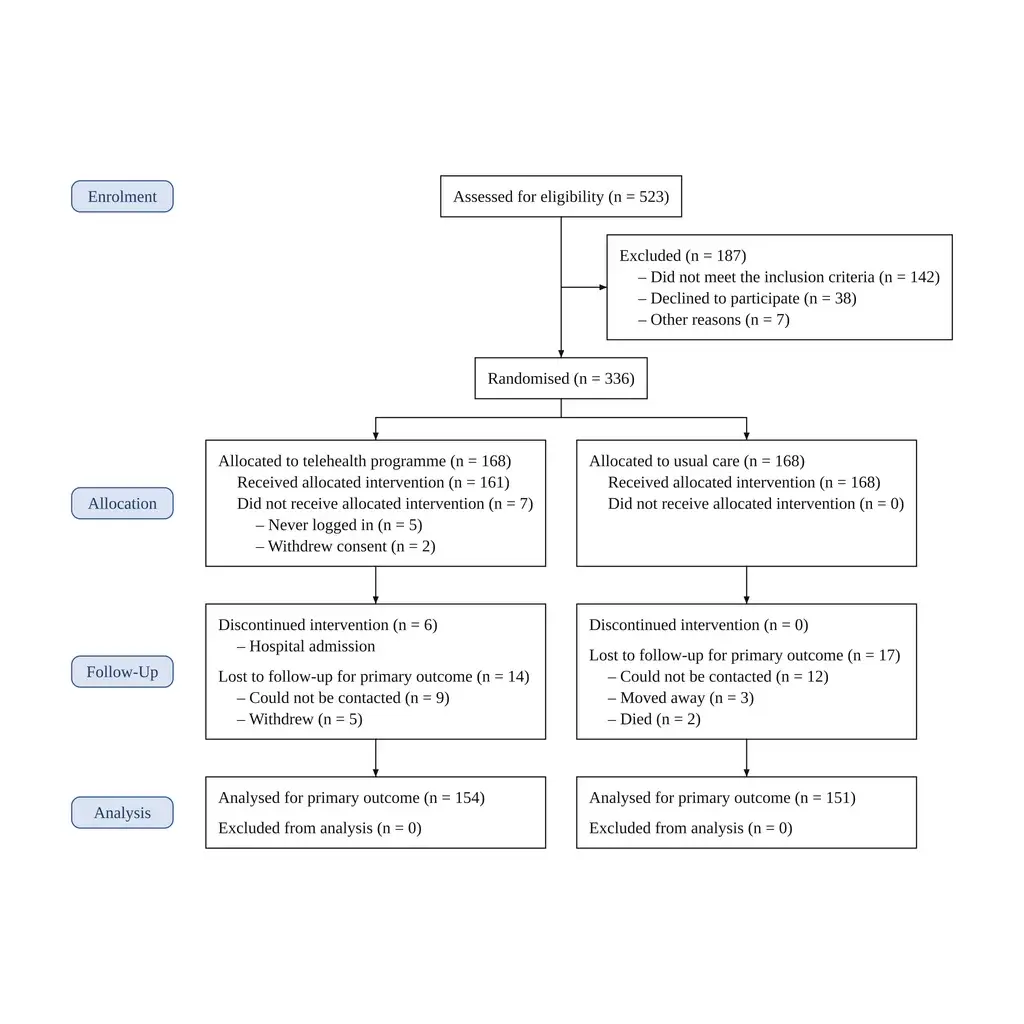
Paste your trial's participant flow and get a CONSORT 2025 flow diagram, counts typeset by code from your text: two to five arms, reasons listed, PNG 300 DPI or SVG.
