PRISMA Flow Diagram Generator for Systematic Reviews

A PRISMA flow diagram shows how many records your systematic review identified, screened, excluded and included, in the PRISMA 2020 layout. Paste your screening counts: Vizcept places each one in its PRISMA 2020 box and typesets the figure in code, so every count in the figure comes from your text.

PRISMA 2020 templateCounts typeset by codeEditable SVG

PRISMA Flow Diagram Generator

Optional

Enter your screening numbers on the left to generate your own PRISMA flow diagram

How to Make a PRISMA Flow Diagram in Three Steps

Your counts in, a labeled figure out.

You already have the numbers in your screening spreadsheet. The slow part is redrawing the boxes and arrows every time a reviewer sends the counts back. Paste the numbers as a sentence and let the generator lay out the three phases.

1

Write Out Your Screening Counts

Type the numbers in plain English or Chinese, or paste the paragraph from your methods section: records identified, duplicates removed, records screened and excluded, reports sought and not retrieved, full texts assessed, exclusions with reasons, and studies included. Give each database its own count if you want them listed separately.

2

Get the Three-Phase Layout

A text model places each count in its box, and code lays out Identification, Screening and Included as the PRISMA 2020 template does: the main flow runs down, every exclusion branches to a box on the right, and a count you never gave stays a blank (n = ) rather than a guess.

3

Check the Boxes, Then Export

Read each box against your screening log: the digits come from your text, but which box each one sits in is the model's reading. Download PNG at 300 DPI for Word and journal submission; paid plans and credit packs also get SVG, which keeps every label as editable text on a typeset figure.

What is a PRISMA flow diagram?

A PRISMA flow diagram is the figure in a systematic review that reports how many records were identified, screened and excluded, and how many studies were included, and why full-text reports were excluded. PRISMA stands for Preferred Reporting Items for Systematic Reviews and Meta-Analyses.

Item 16a of the PRISMA 2020 checklist asks authors to describe the results of the search and selection process, "ideally using a flow diagram". The diagram counts three different things:

TermWhat it means in PRISMA 2020
RecordThe title or abstract of a report, as indexed in a database or website. The same report found twice is a duplicate.
ReportA document about a study: a journal article, preprint, conference abstract, register entry or dissertation.
StudyThe investigation itself. One study can have several reports.

Which PRISMA 2020 flow diagram template do you need?

PRISMA 2020 has four flow diagram templates. Pick by two questions: is this a new review or an update, and did you search only databases and registers, or other sources too?

Your reviewTemplate
New review, databases and registers onlyOne column: Identification → Screening → Included
New review, plus websites, organisations or citation searchingTwo columns: databases and registers on the left, other methods on the right
Updated review, databases and registers onlyAdds a box for studies included in the previous version
Updated review, plus other sourcesTwo columns plus the previous-version box

Mention your sources in the description and the layout follows. The two new-review templates are typeset by code; the two update templates are drawn by the image model, so check every number on those. Scoping reviews usually adapt the same flow, reporting "sources of evidence". Cite the diagram's source as: Page MJ, McKenzie JE, Bossuyt PM, et al. The PRISMA 2020 statement: an updated guideline for reporting systematic reviews. BMJ 2021;372:n71.

How do the PRISMA counts have to add up?

Reviewers check that every box follows from the one above it. Run these subtractions on your screening log before you generate. Vizcept sets your numbers as you wrote them and does not balance them, so a slip in your log shows up in the figure too.

  1. Records identified − records removed before screening = records screened
  2. Records screened − records excluded = reports sought for retrieval
  3. Reports sought − reports not retrieved = reports assessed for eligibility
  4. Reports assessed − reports excluded (all reasons added up) = reports of included studies
  5. Studies included in the previous version + new studies included = total studies included in review (updated reviews only; the same holds for reports)

Three rules keep the boxes consistent:

  • Count each excluded report once, under its primary reason, so the reasons add up to the reports-excluded total.
  • Write down each database's count before you remove duplicates. Some citation managers remove duplicates as you import, and the PRISMA 2020 template asks for per-database counts where feasible.
  • If an automation tool excluded records, give the human and the automation counts separately.

A worked example:

BoxWhat goes in itnCheck
Records identified (1,190 databases + 58 registers)Every hit from each database and register, before duplicates are removed1,248
Removed before screening (duplicates)Duplicates, automation-tool exclusions, other removals3121,248 − 312 = 936
Records screenedTitles and abstracts you read936
Records excludedRecords ruled out at title/abstract812936 − 812 = 124
Reports sought for retrievalFull texts you tried to obtain124
Reports not retrievedFull texts you could not get6124 − 6 = 118
Reports assessed for eligibilityFull texts read against your criteria118
Reports excluded: wrong population 41, wrong outcome 33, not an RCT 23Each excluded report once, under its primary reason9741 + 33 + 23 = 97; 118 − 97 = 21
Reports of included studiesReports of the studies in your review21

If one study has several reports, the number of included studies can be smaller than the number of reports — say both. Why the finished figure still needs checking.

How the counts get from your text into the figure

When an image model draws a flow diagram, every box and digit is painted as pixels from your description, and nothing ties a painted digit to the number you wrote. Vizcept splits the job in two:

  • Reading: a text model (Anthropic Claude Sonnet 4.6, with OpenAI GPT-5.2 as a fallback) reads your counts and returns which number belongs in which PRISMA 2020 box, as structured data.
  • Drawing: code lays out the template from that data and sets every word and digit in a font. No part of a typeset figure is painted by an image model.

Three rules follow:

  1. Every count above zero must appear in your text. If the model returns a number that is not in your description (say it subtracted 312 from 1,847 to get 1,535), the number is removed and the box shows a blank "(n = )". The check looks for the number anywhere in your text, not next to that box, so a worked-out count that equals another number you wrote gets through. A 0 stays only when your text has a 0 or says none or all.
  2. Sources go where you screened them. Records screened together with your database records are listed in the identification box; only sources with their own retrieval and eligibility counts get the other-methods column.
  3. The arithmetic is yours. The figure shows your numbers even when they do not add up; it does not balance them.

The image model draws the whole figure instead, so check every number on it, when:

  • the layout is outside the two new-review templates: an updated review with a previous-studies column, the PRISMA 2009 four-phase layout, or a flow that is not a literature search, such as a cohort's sample selection;
  • your description contains a character the fonts cannot set, such as Korean, Arabic or Thai script, or an emoji (Chinese is supported);
  • a single box would list more than 16 sources or reasons;
  • you attach an image, such as a sketch or an existing figure, before generating;
  • reading, layout or saving fails partway, and the run is handed to the image model;
  • you change a finished figure with Edit with AI.

The result does not yet show which way a figure was made. More on how Vizcept draws each kind of figure.

Can you use a Vizcept PRISMA diagram in a published review?

Yes, and you own the figure. Two things to do before you submit:

  • Disclose the tool. A text model read your description to place the counts, so treat the figure as AI-assisted even though code drew it. Elsevier, Wiley and Taylor & Francis allow AI help with explanatory figures such as flow diagrams if you disclose it, and several want the disclosure in the caption. Springer Nature does not permit "creating content from text prompts" but allows "diagrams derived from author-developed content", so ask the editor. See the publisher policy table and AI disclosure statement generator.
  • Cite PRISMA 2020. Page MJ, McKenzie JE, Bossuyt PM, et al. The PRISMA 2020 statement: an updated guideline for reporting systematic reviews. BMJ 2021;372:n71.

Writing a thesis? The conceptual framework generator covers the framework chapter too. Reporting a randomized trial rather than a review? The CONSORT flow diagram generator typesets that figure from your participant flow the same way.

Is a PRISMA diagram a quasi-experimental design figure?

No. A PRISMA flow diagram reports how records moved through a review. A quasi-experimental design diagram shows treatment and time: a comparison group, an interrupted time series, or both. Reporting flow is not the design. Draw the design on the quasi-experimental designs guide, and keep this tool for the review’s counts.

PRISMA flow diagram generator, Word template, Shiny app, Covidence or Rayyan?

The six common ways to make the figure differ in what you type and who places the numbers.

OptionCostWhat you enterDownloadWho places the numbers
PRISMA 2020 Word templatesFree (CC BY 4.0)Every n, typed into the boxesWord (.docx), four versionsYou
PRISMA2020 Shiny app and R packageFree, open sourceA data-entry form or CSVHTML (interactive), PDF, PNG, SVG and moreThe app, from your form
Covidence$339 a year for one review, $907 for up to three, or an institutional licence; free trial with 500 recordsYour sources at import, or each database's count if you imported from a citation managerWord (.docx), or copy the counts as textCovidence, from your screening
RayyanEssential, Advanced and institutional plansDatabases, registers, not-retrieved, assessed and included counts; Rayyan fills duplicates and screening countsPDF, PNG, SVG, interactive HTMLRayyan and you
SciDraw AI (how it compares)5 credits a diagram; 10 credits on sign-up plus 5 a dayA description of your search and countsPNG, SVG and PPTXAn AI image model draws each box and digit
VizceptFree credits on sign-up; signed in, a diagram typeset by code costs 2 credits; a one-time pack of 150 credits is $19.90, valid 365 days, no renewalYour counts in a sentence or your methods paragraph, in English or ChinesePNG at 300 DPI (watermarked on free credits); editable SVG on paid plans and packsA text model assigns each count; code typesets it; counts above zero not in your text stay blank

The Word templates and the Shiny app place each number exactly where you type it, with no AI involved. Vizcept sets the digits from your text but a model decides which box each goes in, so read each box once. Prices checked 19 September 2026; SciDraw AI checked 25 October 2026.

Who Needs a PRISMA Diagram

Students · Researchers · Methods teachers

A PRISMA flow diagram is a reporting requirement, not a design choice. These are the three groups that hit that requirement most often.

Thesis and Dissertation Students

First systematic review, hard deadline

Your supervisor asked for a PRISMA diagram and you have never drawn one. You know your counts; you do not know which box the 'reports not retrieved' number belongs in. Start from a correct layout instead of a blank canvas.

  • Three-phase structure comes pre-arranged
  • Redraw in seconds when your screening counts change
  • Free credits on sign-up, no payment details needed
Draw My First PRISMA Diagram

Systematic Reviewers and Meta-Analysts

Submission-ready figures, fast revisions

Reviewer 2 asked you to split the database column from citation searching, and your counts shifted after the update search. Regenerate the whole figure from a revised sentence rather than nudging boxes in PowerPoint.

  • Two-column variant for databases plus other methods
  • Exclusion reasons listed one per line, with their counts
  • Editable SVG on paid plans and credit packs
Generate a Review Figure

Methods Instructors and Librarians

Teaching evidence synthesis

You teach search strategy and screening to cohorts who have never seen a flow diagram. Produce a blank template for a handout, then a filled example with realistic counts, without opening drawing software.

  • Blank template variant with empty count boxes
  • Worked examples at any scale, from 40 records to 4,000
  • Consistent look across every handout in a course
Build a Teaching Template

PRISMA Flow Diagram Examples

Six review designs

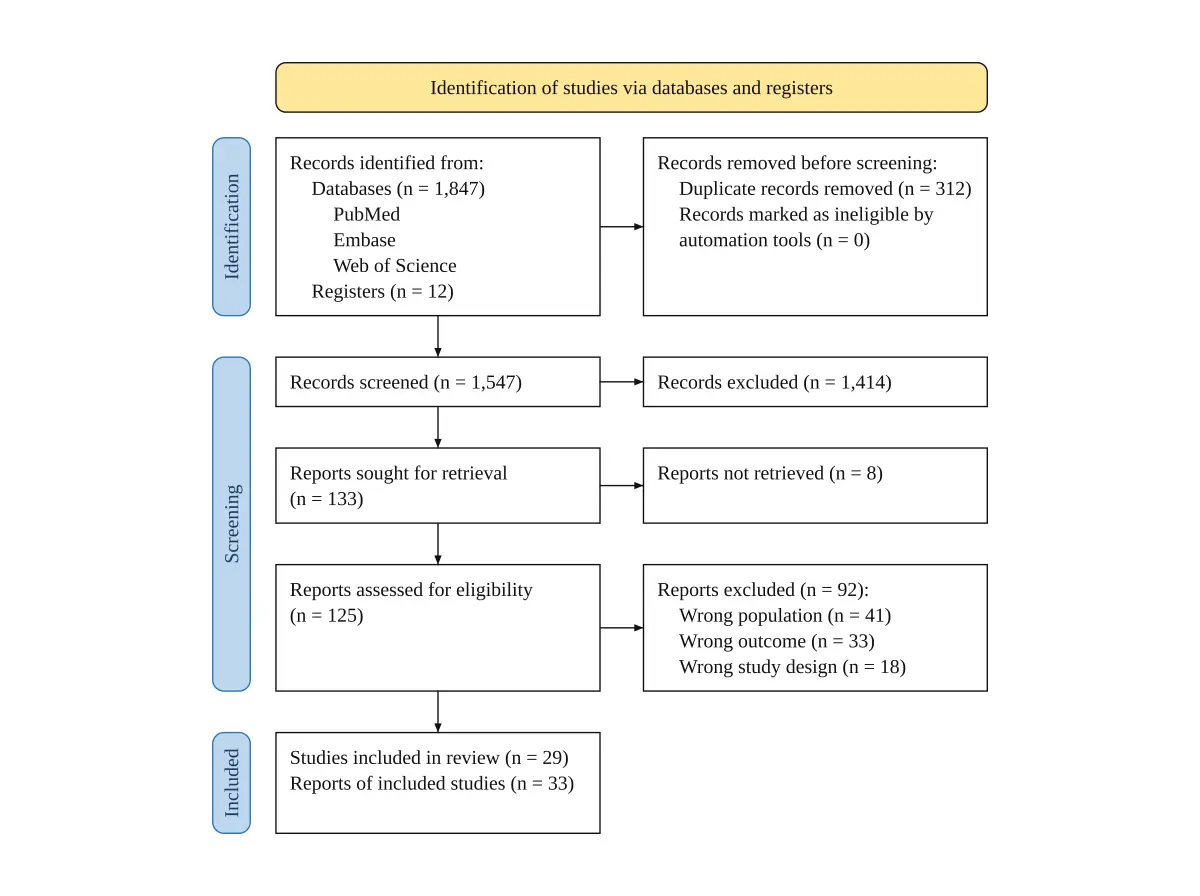
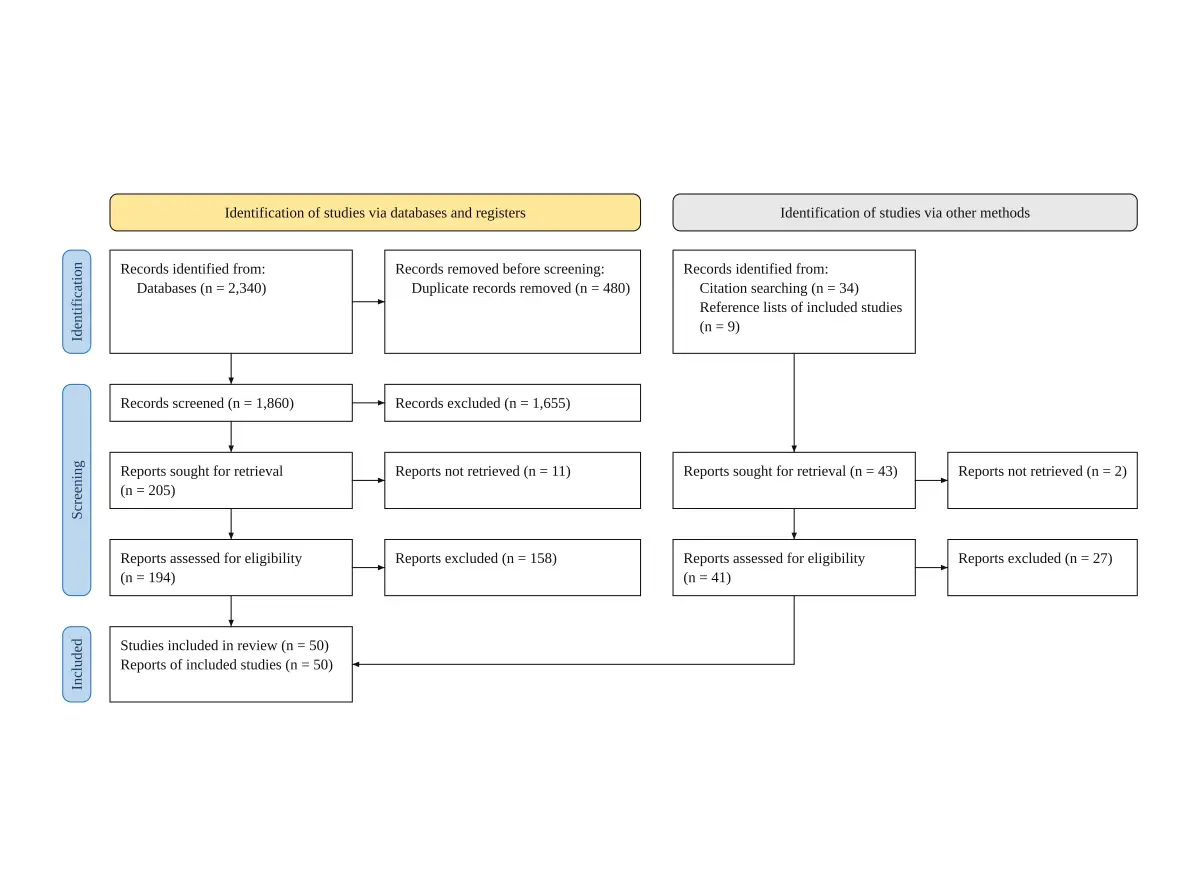
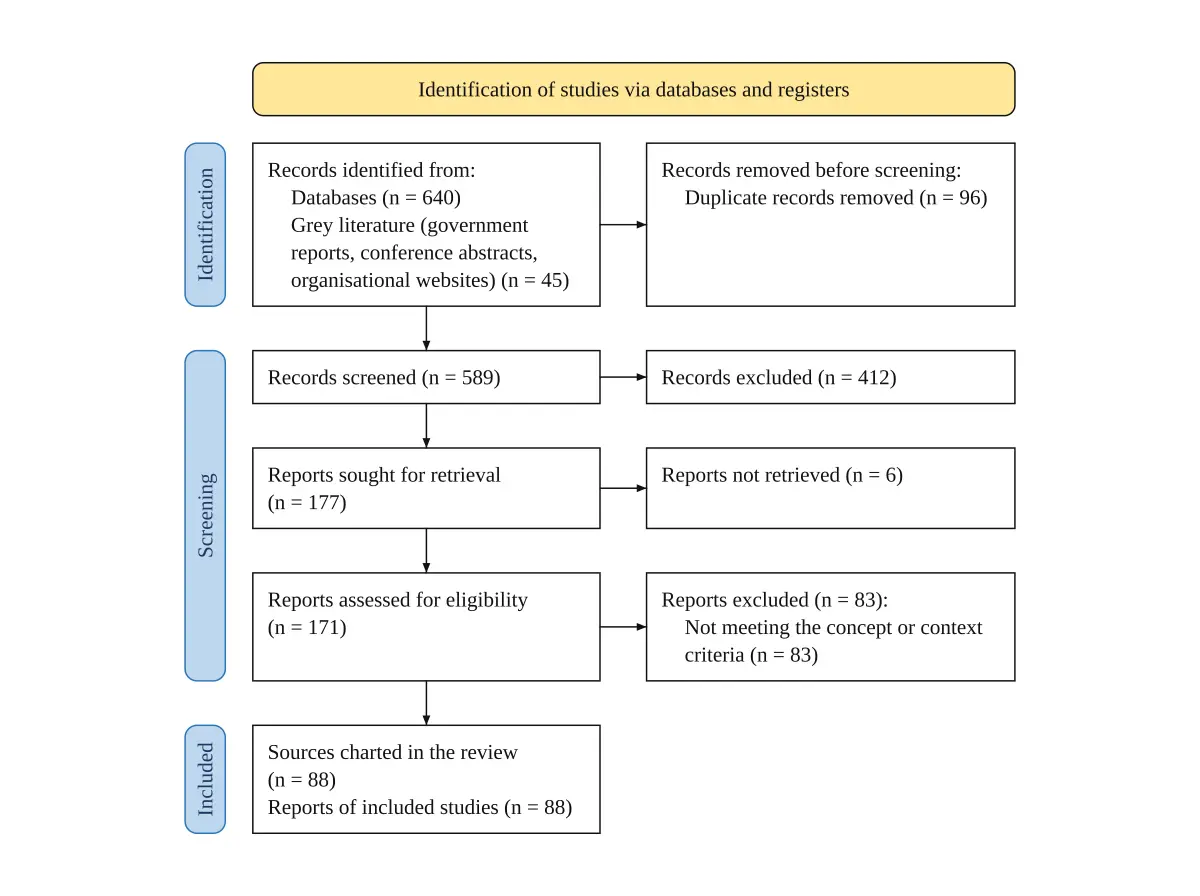
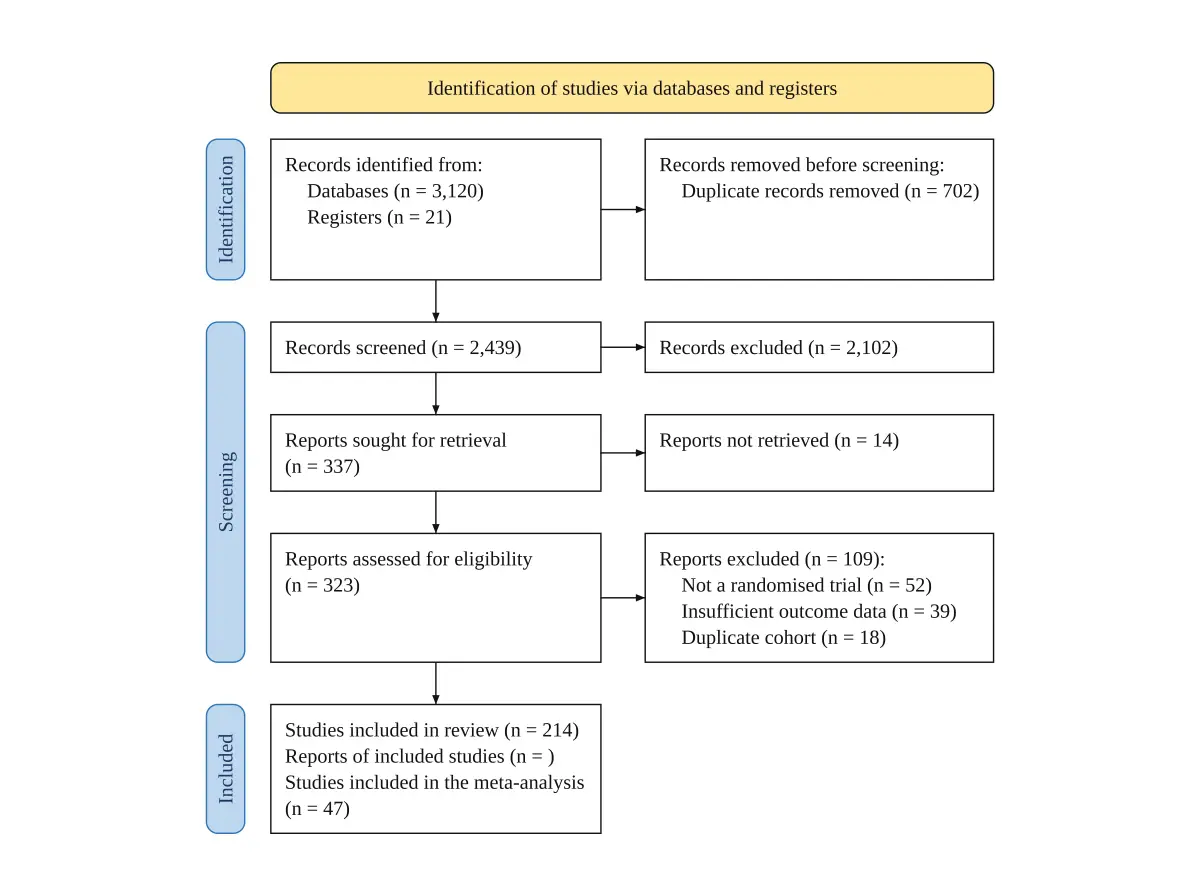
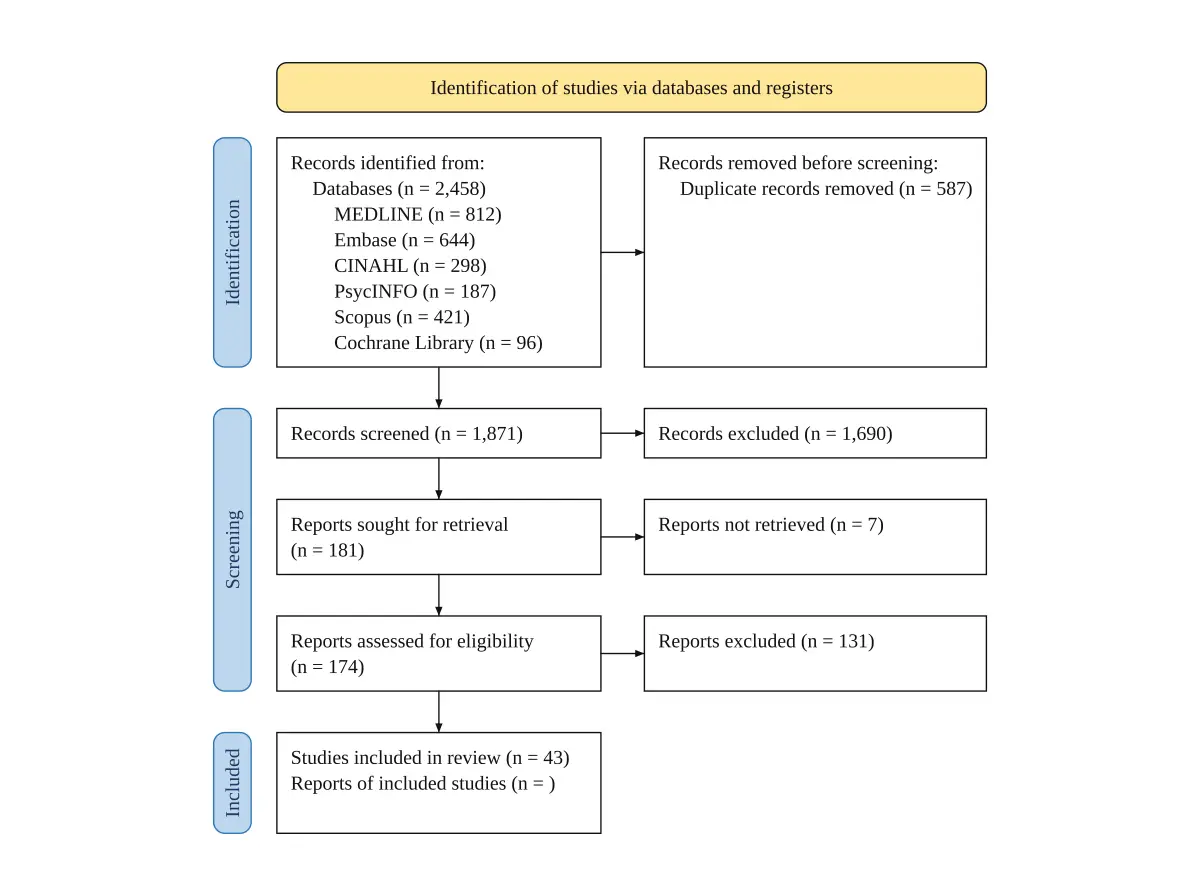
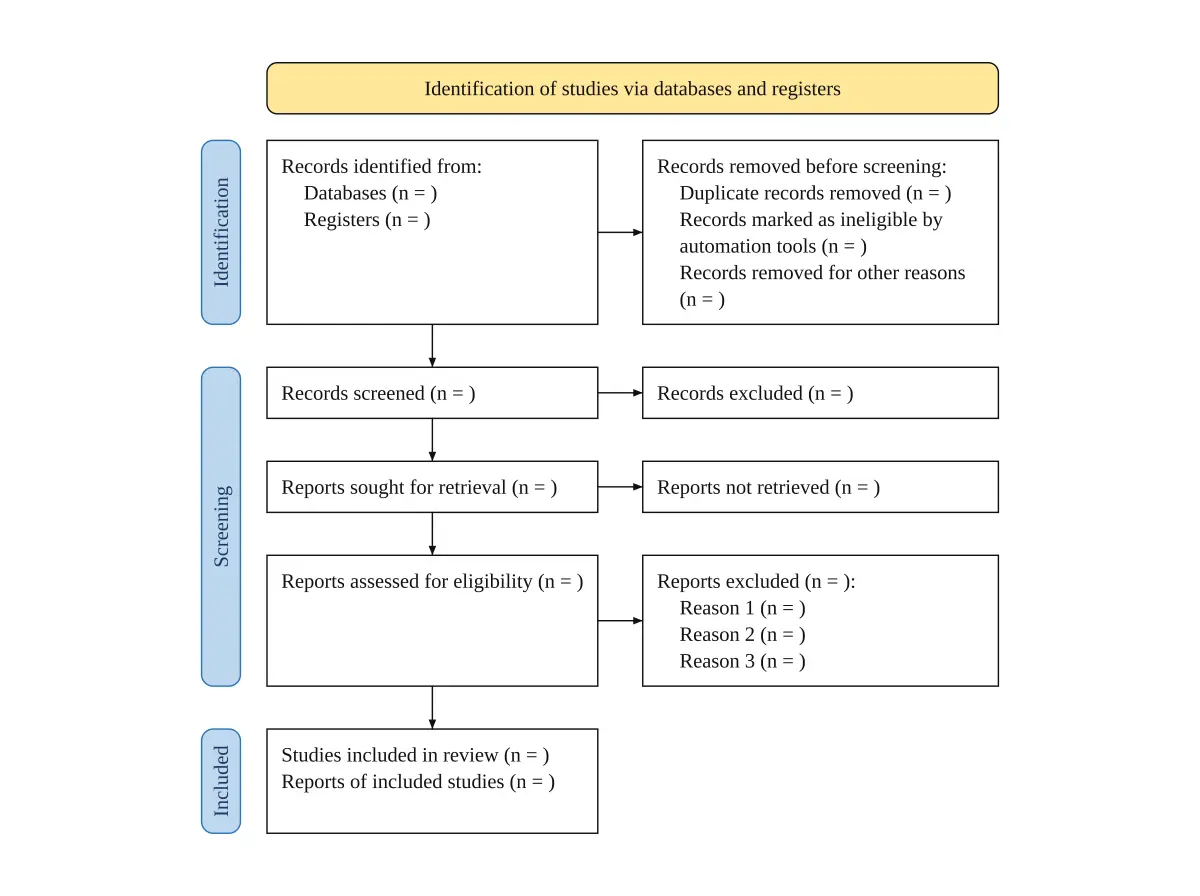
Each figure below is the code-typeset output for the text shown underneath it, unedited. Reuse an example as a starting point and swap in your own counts.

Standard PRISMA 2020

Standard PRISMA 2020

Databases and registers only, single column, three phases

Databases Plus Other Methods

Databases Plus Other Methods

Two-column PRISMA 2020 with citation searching on the right

Scoping Review

Scoping Review

PRISMA-ScR style with grey literature and charted sources

Meta-Analysis

Meta-Analysis

Studies in the meta-analysis listed as an extra line in the included box

Multiple Databases Broken Out

Multiple Databases Broken Out

Per-database record counts listed inside the identification box

Blank Template

Blank Template

Empty count boxes for a class handout or thesis appendix

What This PRISMA Flow Diagram Generator Does

Built around the 2020 statement

The PRISMA 2020 flow diagram has a fixed anatomy: three phases, a downward main path, and exclusions branching right. Vizcept builds that anatomy in code and fills it with the counts from your text, instead of asking an image model to paint the boxes.

Wording

Official PRISMA 2020 Box Labels

Records, reports and studies

In English the boxes use the official PRISMA 2020 wording — 'Records screened', 'Reports sought for retrieval', 'Studies included in review'. Describe your review in Chinese and the boxes use standard Chinese wording, typeset by code like the English. In Spanish or Portuguese the model translates the box labels; proofread them, and any it leaves out stay in English.
Sources

Per-Database Counts in the Identification Box

One line per database

Name each database with its count — MEDLINE n=812, Embase n=644, Scopus n=421 — and each gets its own line in the identification box. The PRISMA 2020 template asks for per-database counts where feasible.

Exclusions

Exclusions With Reasons

Itemised, not lumped together

Write 'excluded with reasons: wrong population n=41, wrong outcome n=33, wrong study design n=18' and each reason gets its own line inside the exclusion box, in your order and wording. Reasons you list without counts are listed without counts, not with empty brackets.

Revisions

Regenerate When Counts Change

Update search, new figure

An update search or a second screener changes half your numbers. Edit the sentence and generate again: the figure is typeset in seconds, rather than dragging boxes and re-typing every n value in a drawing tool.

Export

Editable SVG and 300 DPI PNG

Word, LaTeX, posters

PNG at 300 DPI drops straight into a Word manuscript or slide deck at print quality. On a figure typeset by code, the SVG keeps every label and count as real text, so you can fix a word in Illustrator, Inkscape or PowerPoint without generating again; a figure the image model drew exports as traced shapes. SVG needs a paid plan or credit pack.

Variants

Review Designs Beyond the Default

Scoping, meta-analysis, blank template

A scoping review can rename the final box to charted sources; a meta-analysis can add a line for the studies in the meta-analysis; a teaching handout gets empty boxes with Reason 1, 2 and 3. Grey literature screened together with your database records is listed in the identification box, and other methods with their own retrieval counts get the second column. Updated reviews with a previous-studies column and the PRISMA 2009 layout are drawn by the image model instead, so check every number on those.

Start free, upgrade when you need more

Signing up adds trial credits plus daily check-in credits; a diagram typeset by code costs 2 credits. Upgrade for 4K, no watermark and SVG while you iterate through screening rounds — or buy a one-time credit pack for a single review.

Student or teacher? Apply for an education discount

Apply now

How Researchers Use It

Feedback from people who had to put a PRISMA flow diagram into a thesis, a protocol, or a submission.

Dr

Dr. Amara Okonkwo

Research Fellow, Public Health

Our update search added 400 records three weeks before submission. Regenerating the flow diagram from a revised sentence took under a minute; redrawing it by hand would have taken an afternoon.

Pr

Priya Raghunathan

PhD Candidate, Nursing

I could never remember whether 'reports not retrieved' sat before or after the eligibility box. Starting from a correct PRISMA 2020 layout meant I was checking numbers instead of second-guessing the structure.

To

Tomás Herrera

Medical Librarian

I support about thirty review teams a year. Being able to hand someone a blank template and a worked example in the same session has made the search-strategy consultations much shorter.

PRISMA Flow Diagram Generator — Common Questions

FAQ

Write your screening counts as a sentence — records identified, duplicates removed, records screened and excluded, reports sought and not retrieved, full texts assessed, exclusions with reasons, and studies included — then click Generate. Signing up adds trial credits and daily check-in credits, valid for 30 days.

Yes. The figure uses the three phases named in the PRISMA 2020 statement — Identification, Screening, Included — with phase labels down the left edge, the main flow running top to bottom, and exclusion counts branching to boxes on the right. Both the databases-and-registers layout and the two-column databases-plus-other-methods layout are typeset by code.

The 2009 version used four phases: Identification, Screening, Eligibility, and Included. PRISMA 2020 folds eligibility assessment into the Screening phase, adds a box for records removed before screening (duplicates, automation tools, other reasons), separates 'reports sought for retrieval' from 'reports assessed for eligibility', and adds a second column for studies found via other methods. It also renamed 'studies included in qualitative synthesis' to 'studies included in review', dropped the box for studies in quantitative synthesis (meta-analysis), and added boxes for studies carried over from the previous version of an updated review (Haddaway et al., Campbell Systematic Reviews 2022).

Yes. A PRISMA 2020 diagram for a meta-analysis ends at 'Studies included in review' and 'Reports of included studies'. PRISMA 2020 renamed the 2009 box 'studies included in qualitative synthesis' to 'studies included in review', because some readers took it to mean a synthesis of qualitative data, and it dropped the box for studies in the meta-analysis, because a review usually runs several meta-analyses that each include a different number of studies. If your journal or supervisor still wants that number in the figure, write it in your description and it is added as an extra line in the included box. For a scoping review (PRISMA-ScR), say how you want the final box worded, such as sources of evidence charted, and the label follows your wording.

Yes, digit for digit, when code typesets the figure. Any count above zero that does not appear in your description is removed and its box is left blank (n = ). A 0 stays only if your text says 0, none or all. Check two things. Placement: a text model decides which box each number goes in, and the check looks for the number anywhere in your text, not next to that box, so a worked-out count that equals another number you wrote is not caught. Route: the image model draws the figure instead when you attach an image, use characters the fonts lack, ask for an updated-review or PRISMA 2009 layout, use Edit with AI, or a run fails partway. The result does not yet say which route it took.

To change a count or a label, edit your description and generate again; the typeset figure follows your text. The edit tool works differently: marking up the diagram sends it to the image model, which redraws the whole figure, so after an edit check every number again. In the SVG of a typeset figure you can also fix a word or a count directly in a vector editor.

PNG at 300 DPI for Word manuscripts, slides and most journal submission systems, and SVG. For a figure typeset by code, the SVG keeps every word and count as editable text; a figure drawn by the image model is traced into vector shapes, so its text cannot be edited. Free downloads are watermarked 2K PNGs; the clean original, 4K and SVG need a paid plan or credit pack. There is no PDF export; insert the PNG or SVG into Word and save the document as PDF.

Download the PNG and use Insert > Pictures in Word; at 300 DPI it stays sharp at column width. Word in Microsoft 365 and Word 2019 or later also insert SVG through the same menu, and the SVG of a code-typeset figure keeps its labels as text (SVG needs a paid plan or credit pack). If you would rather type the counts into boxes inside Word, the four official PRISMA 2020 templates are .docx files on prisma-statement.org.

If you are reporting a systematic review, effectively yes. Item 16a of the PRISMA 2020 checklist asks you to describe the results of the search and selection process, ideally using a flow diagram, and journals that follow PRISMA check for it. Reviewers use it to check that your record counts reconcile from search to final sample.

It depends on how you screened them. If records from citation searching, websites or organisations went through their own retrieval and eligibility steps, give those counts and the figure switches to the two-column PRISMA 2020 layout: databases and registers down the left, other methods down the right, both feeding one included box. If they were deduplicated and screened together with your database records, they are listed in the identification box under the databases instead, and the single column follows your screening counts.

Yes. You own the figures you generate, so you can use them in theses, dissertations, journal submissions, posters and teaching material. Journals may ask you to disclose the AI tool in the caption, and paid plans remove the watermark.

Generate a blank template: every box keeps its standard wording with an empty (n = ) count, and the reports-excluded box lists Reason 1, 2 and 3, which is also the version methods instructors hand out in class. Or generate with the counts you have: boxes you have no number for stay blank, and you regenerate once screening finishes.

Yes. PRISMA is used well beyond clinical research — education, management, information systems, environmental science, and software engineering reviews all report screening counts the same way. The phase structure does not change; only your database names and exclusion reasons do.

A general chatbot can write flowchart code, such as Mermaid, or draw an image of one. Either way, compare the box labels with the PRISMA 2020 template and run the subtractions on this page against what it gives you. On Vizcept the digits are set from your text, but the subtractions are still yours: the figure shows your numbers even when they do not add up.

Your PRISMA Flow Diagram, Counts Set From Your Text

Turn your screening counts into a PRISMA 2020 figure typeset by code, check each box against your log with the subtractions on this page, and export PNG at 300 DPI or editable SVG on paid plans.

Unlock all tools

One subscription unlocks every Vizcept AI diagram tool — from free body diagrams and syntax trees to biology diagrams and more.

View pricing

Other tools you might like

Explore more AI diagram tools across subjects — from the same discipline and beyond.

AI Diagram MakerPopular

AI Diagram Maker

Describe any topic in plain English and get a publication-ready scientific diagram in seconds.

Open tool
Conceptual Framework GeneratorNew

Conceptual Framework Generator

Turn variables, mediators, moderators, and hypotheses into a labeled conceptual framework for thesis and journal research.

Open tool
Graphical Abstract MakerNew

Graphical Abstract Maker

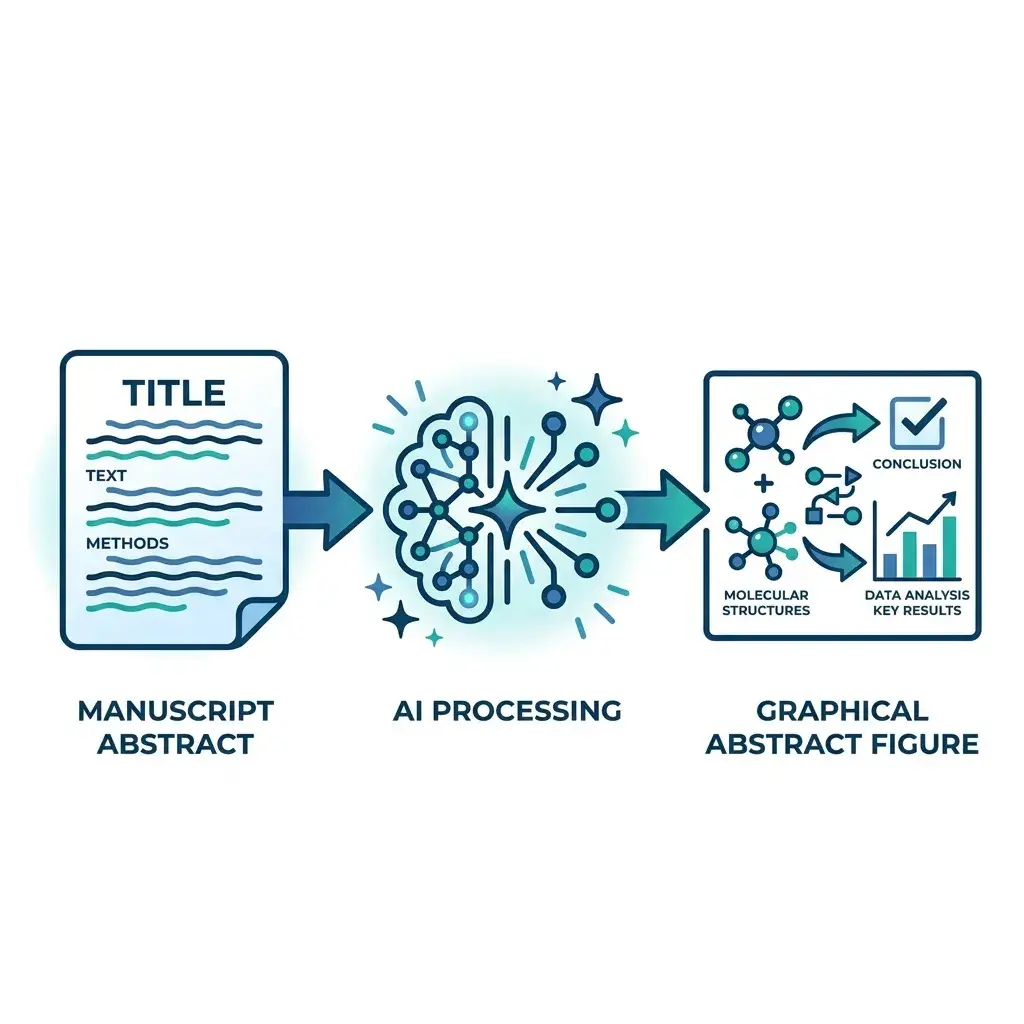
Paste your manuscript abstract — get a journal-ready graphical abstract in Elsevier, Cell Press, Wiley, or ACS dimensions in under a minute.

Open tool
Bell Curve MakerNew

Bell Curve Maker

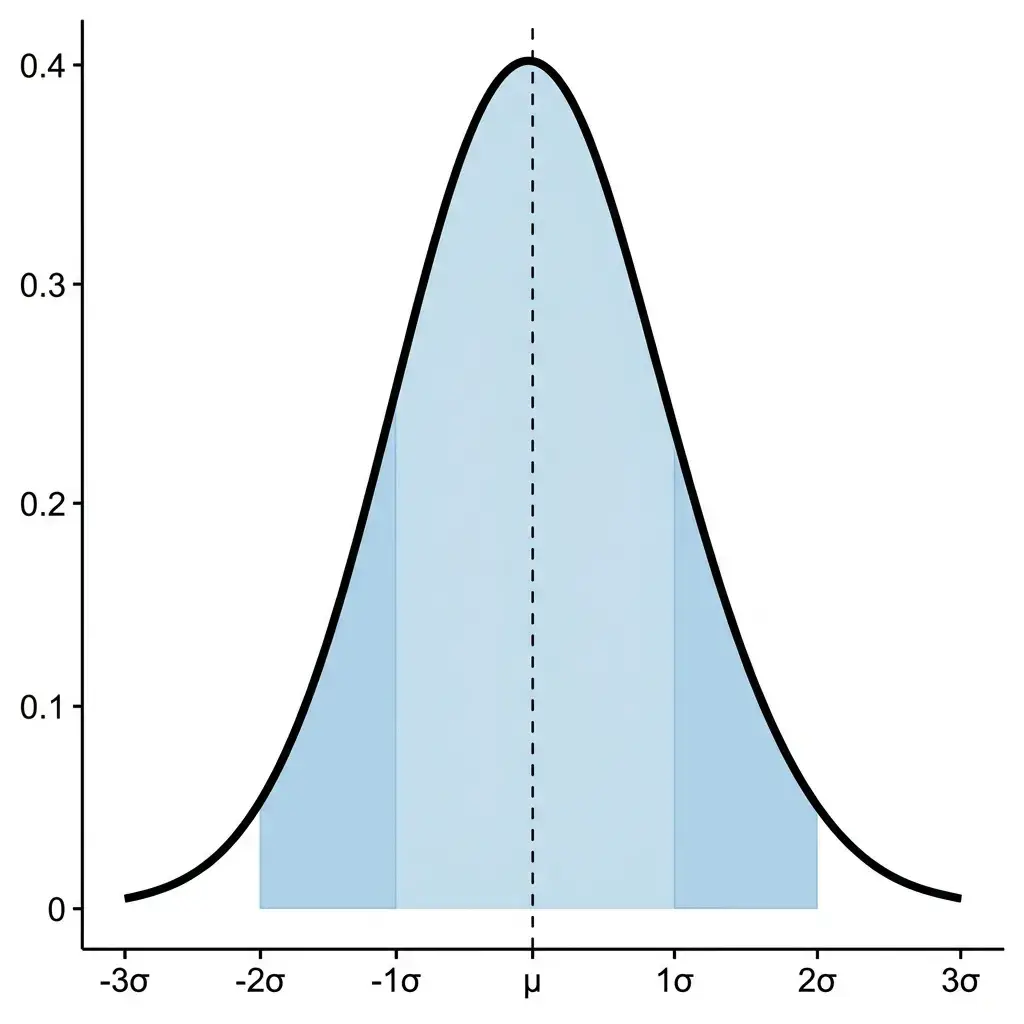
Type a mean and standard deviation, paste data, or set up a confidence interval or hypothesis test, and get an exact normal curve with the shaded area, its probability and the steps.

Open tool
Violin Plot MakerNew

Violin Plot Maker

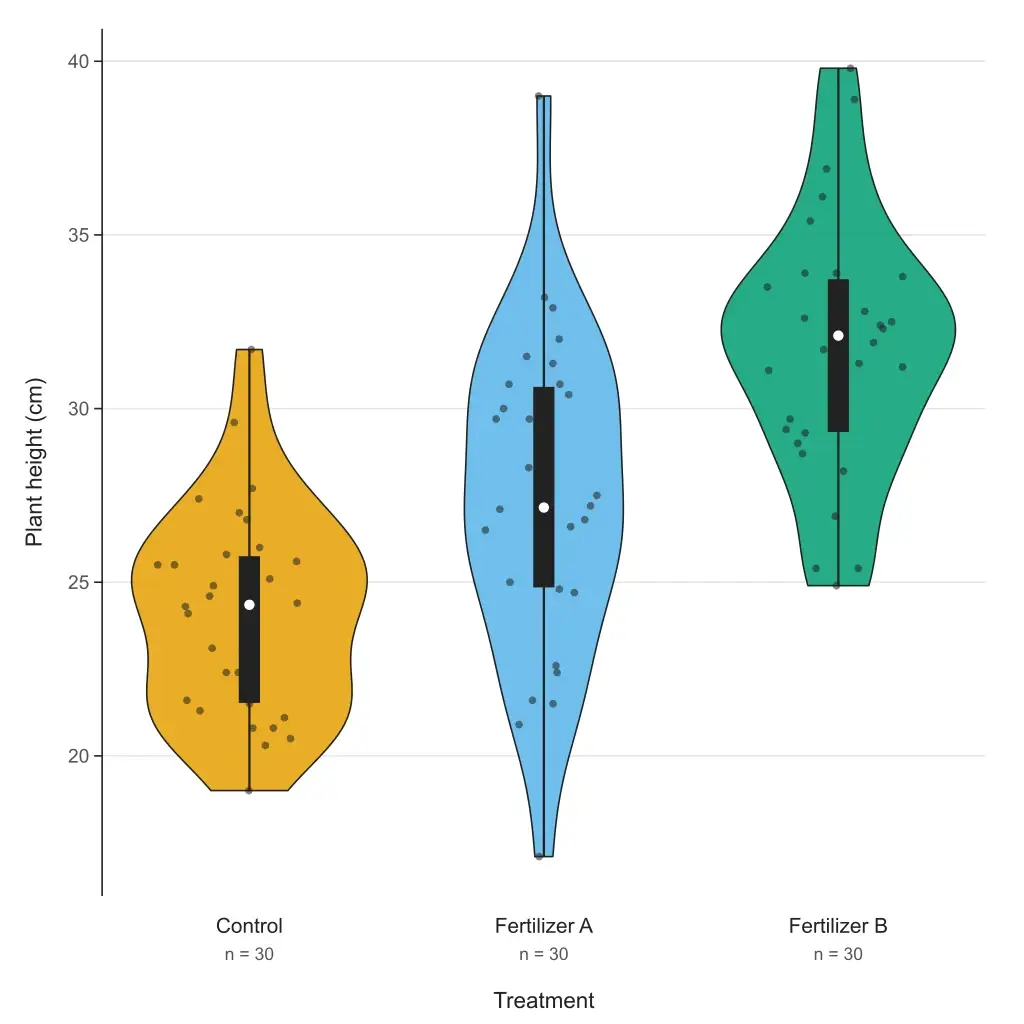
Paste your data and get a violin plot in your browser — grouped or single, box or quartiles inside, adjustable bandwidth, editable SVG and 300 DPI PNG. Free to paste and download; or describe your data and let AI fill it in.

Open tool
Box Plot MakerNew

Box Plot Maker

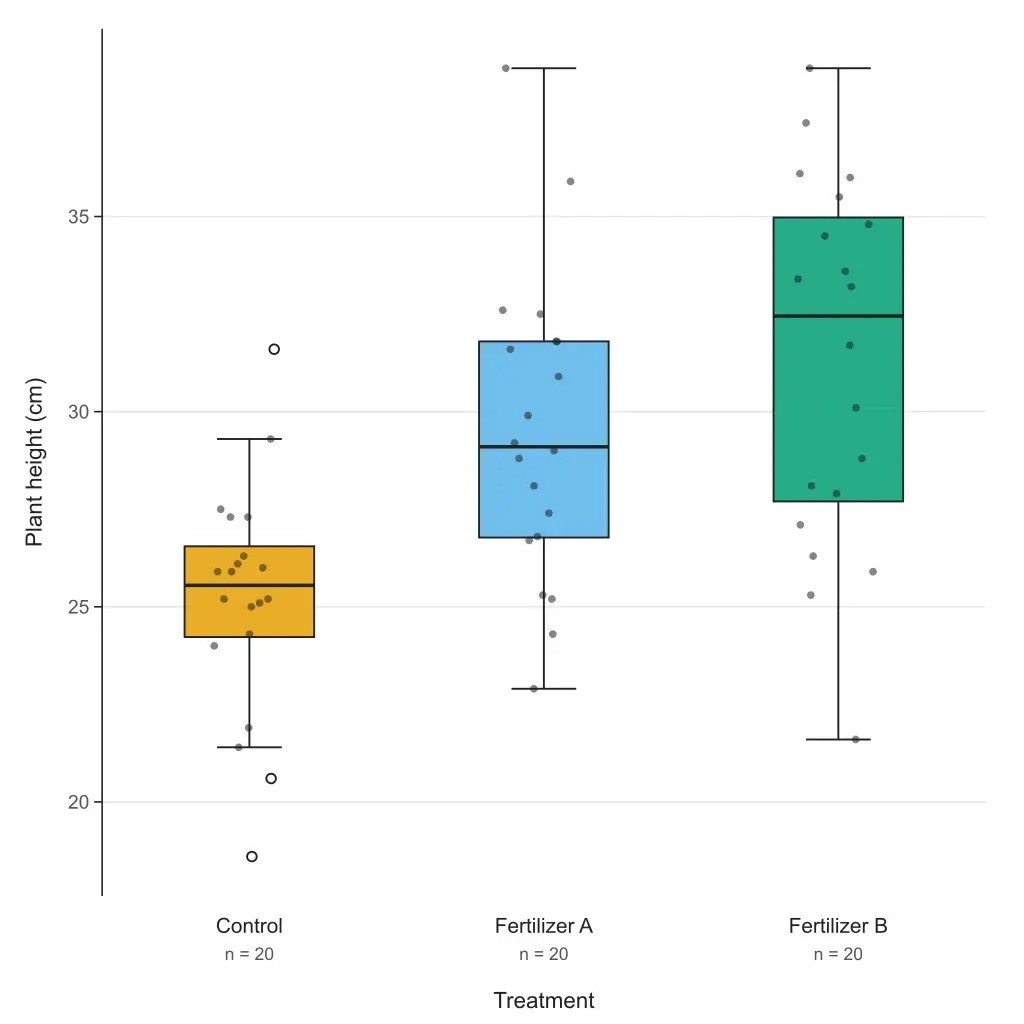
Paste your data or a five-number summary and get a box and whisker plot with quartiles, outliers and labels. Choose the TI-84, Excel or R quartile method; export editable SVG or 300 DPI PNG. Free to paste and download.

Open tool
Scatter Plot MakerNew

Scatter Plot Maker

Paste two columns from Excel or a CSV and get a scatter plot with the line of best fit, its equation, r and R². Groups, point labels and step-by-step working; export editable SVG or 300 DPI PNG. Free to paste and download.

Open tool
CONSORT Flow Diagram GeneratorNew

CONSORT Flow Diagram Generator

Paste your trial's participant flow and get a CONSORT 2025 flow diagram, counts typeset by code from your text: two to five arms, reasons listed, PNG 300 DPI or SVG.

Open tool
Featured on Findly.tools