
What is an IPO conceptual framework?
An IPO conceptual framework describes a study as three connected boxes:
| Box | What goes in it | Example items |
|---|---|---|
| Input | What the study starts with: the respondents' profile, the variables you measure, or the requirements of a system you build | Profile of the respondents, study habits, software requirements |
| Process | What you do with the input: how you gather data, how you analyze it, or the development steps | Survey questionnaire, interviews, statistical treatment, agile development |
| Output | What the study produces: the findings, or a proposed program, plan or system | Proposed enhancement program, action plan, web-based system |
Arrows run left to right, from input to process to output. Many frameworks add a feedback arrow from output back to input, to show that the output is meant to improve the inputs of the next cycle. Some programs call the same figure the research paradigm or the paradigm of the study.
IPO framework vs IV–DV framework: which one do you need?
The two common shapes of a conceptual framework answer different questions.
| IPO framework | IV–DV framework | |
|---|---|---|
| Shows | The flow of the study: what goes in, what you do, what comes out | The relationships you test between variables |
| Boxes | Three: input, process, output, each with a list of items | One per variable: independent, dependent, sometimes a mediator or moderator |
| Arrows | Between the three boxes, plus an optional feedback arrow | One per hypothesis, often labeled H1, H2… |
| Common in | Descriptive studies, studies that end in a proposed program, capstone projects that build a system | Correlational and causal studies that test hypotheses |
If your study proposes something (a program, a plan or a system), an IPO framework usually fits. If it tests whether one variable predicts another, use the IV–DV shape instead; see the conceptual framework examples by field and mediator vs moderator, with diagrams. Follow your department's template when it names one.
The six examples below move from descriptive studies to a capstone that builds a system. Each one shows the figure, the description that produced it and a sample write-up you can adapt.
Education IPO framework: study habits and academic performance (with feedback)
A descriptive-correlational study of Grade 11 students. The input box lists the respondent profile and the two variables measured; the process box lists how the data were gathered and treated; the output is the program the study proposes. The arrow from output back to input is the feedback loop many programs ask for: the proposed program is meant to change the inputs of the next cycle.
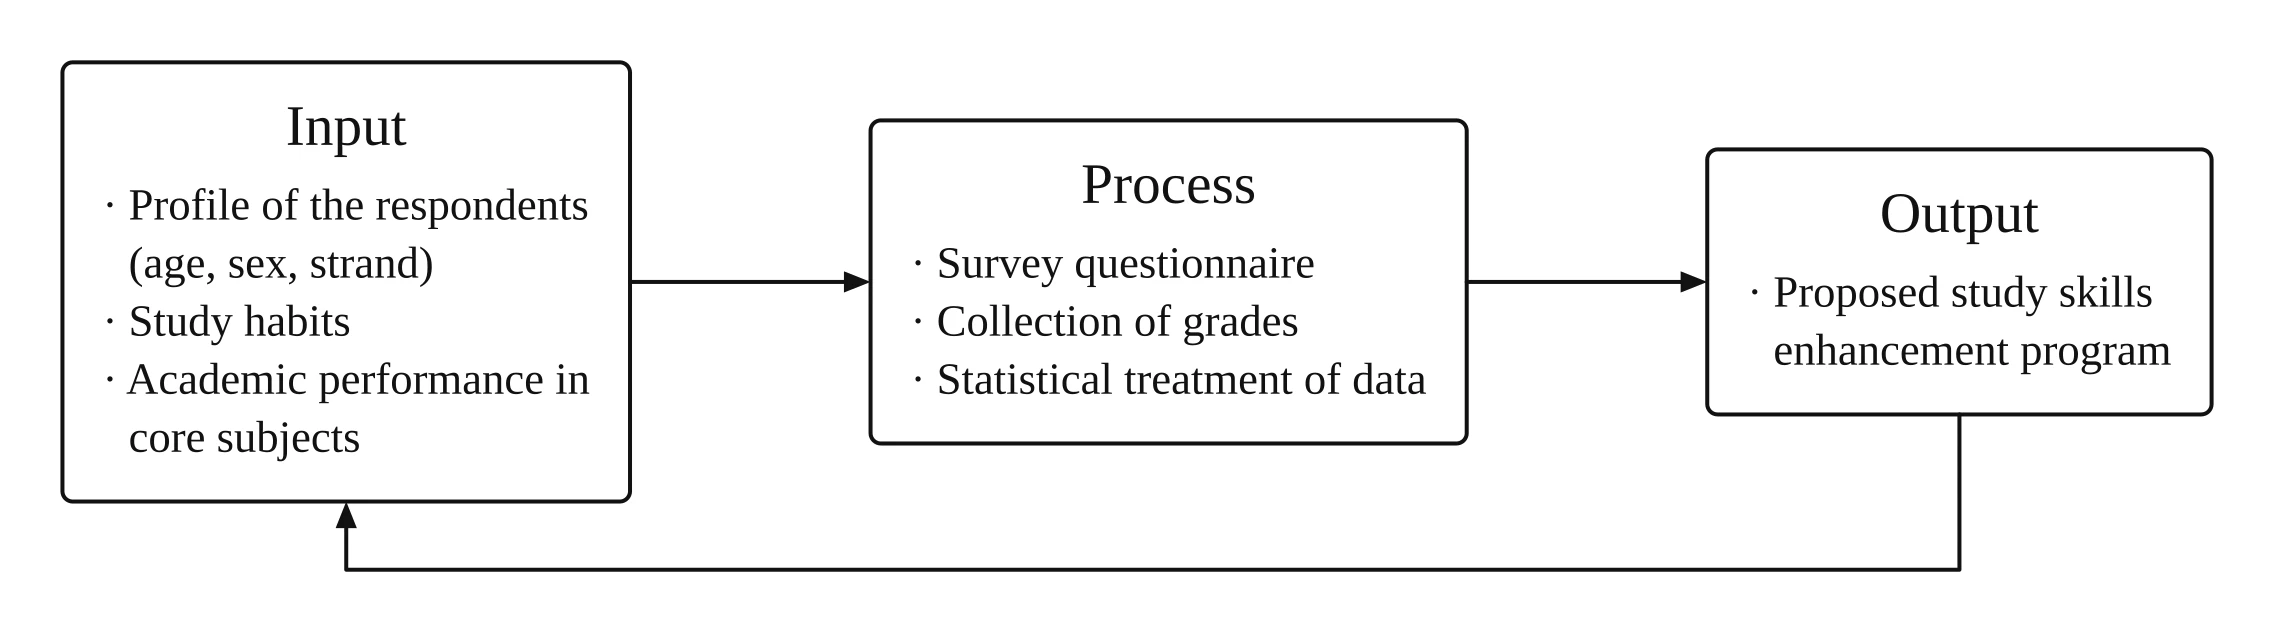
Description used: IPO conceptual framework for my study on study habits and academic performance of Grade 11 students. Input: profile of the respondents (age, sex, strand), study habits, academic performance in core subjects. Process: survey questionnaire, collection of grades, statistical treatment of data. Output: proposed study skills enhancement program. Add a feedback arrow from output back to input.
Sample write-up (use your own figure number): Figure [n] presents the conceptual framework of the study using the input-process-output model. The input consists of the profile of the respondents in terms of age, sex and strand, their study habits, and their academic performance in core subjects. The process covers the administration of a survey questionnaire, the collection of grades and the statistical treatment of data. The output is a proposed study skills enhancement program. The arrow from the output back to the input shows that the program is meant to improve the study habits of the next cohort.
Open this example in the generator and swap in your own variables.
Nursing IPO framework: hypertension self-care in a rural community
Like the education example, this nursing study ends in something it proposes: a health education plan. The process box mixes data gathering (structured interview, blood pressure monitoring) with the analysis in one box.
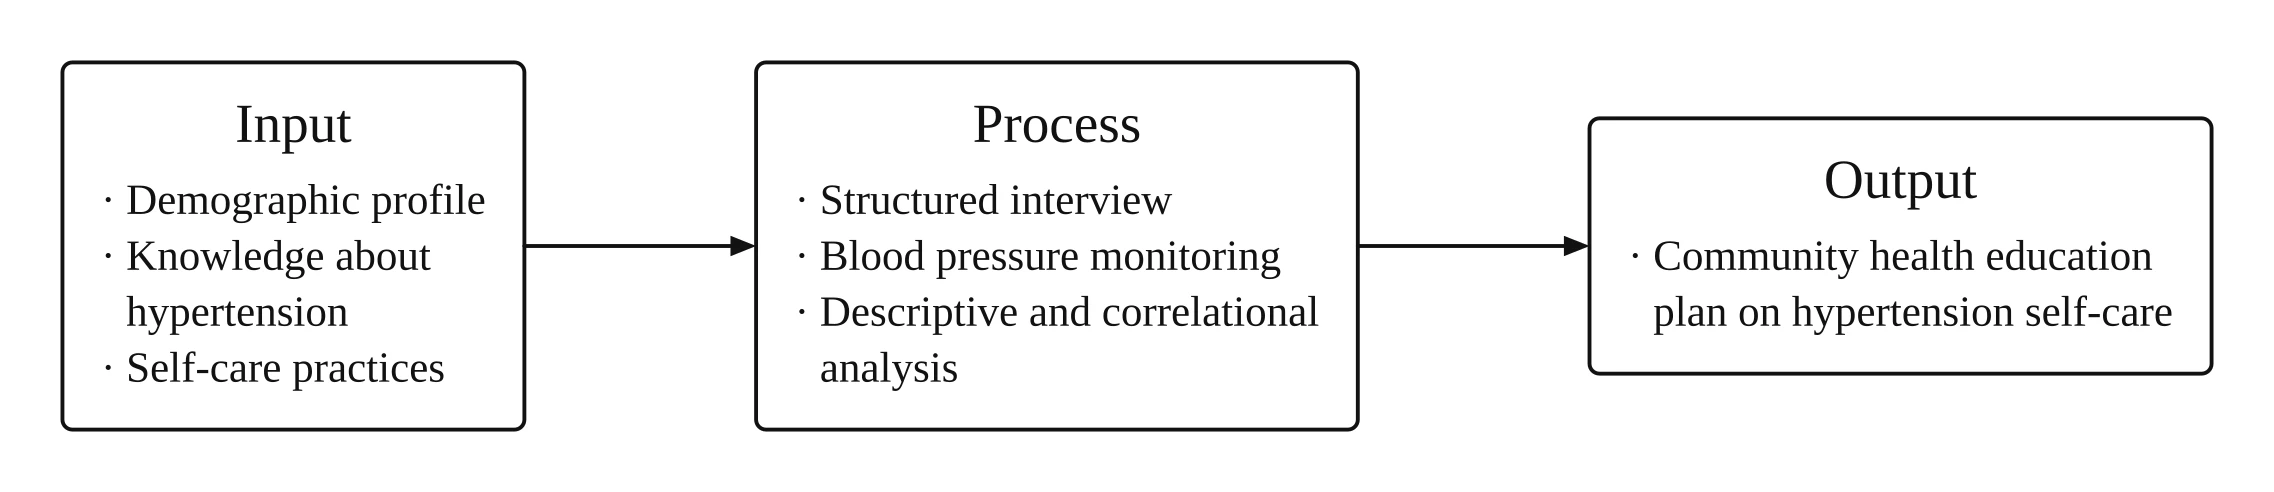
Description used: Input-process-output framework for a nursing study on hypertension self-care among adults in a rural community. Input: demographic profile, knowledge about hypertension, self-care practices. Process: structured interview, blood pressure monitoring, descriptive and correlational analysis. Output: community health education plan on hypertension self-care.
Sample write-up (use your own figure number): Figure [n] presents the conceptual framework of the study. The input consists of the demographic profile of the respondents, their knowledge about hypertension and their self-care practices. The process covers a structured interview, blood pressure monitoring, and descriptive and correlational analysis. The output is a community health education plan on hypertension self-care.
Open this example in the generator and swap in your own variables.
Business IPO framework: digital payment adoption among small retailers
This business administration study combines a survey with interviews. The input box holds the factors the study examines; the process box names a survey, interviews and regression analysis; the output is an action plan.
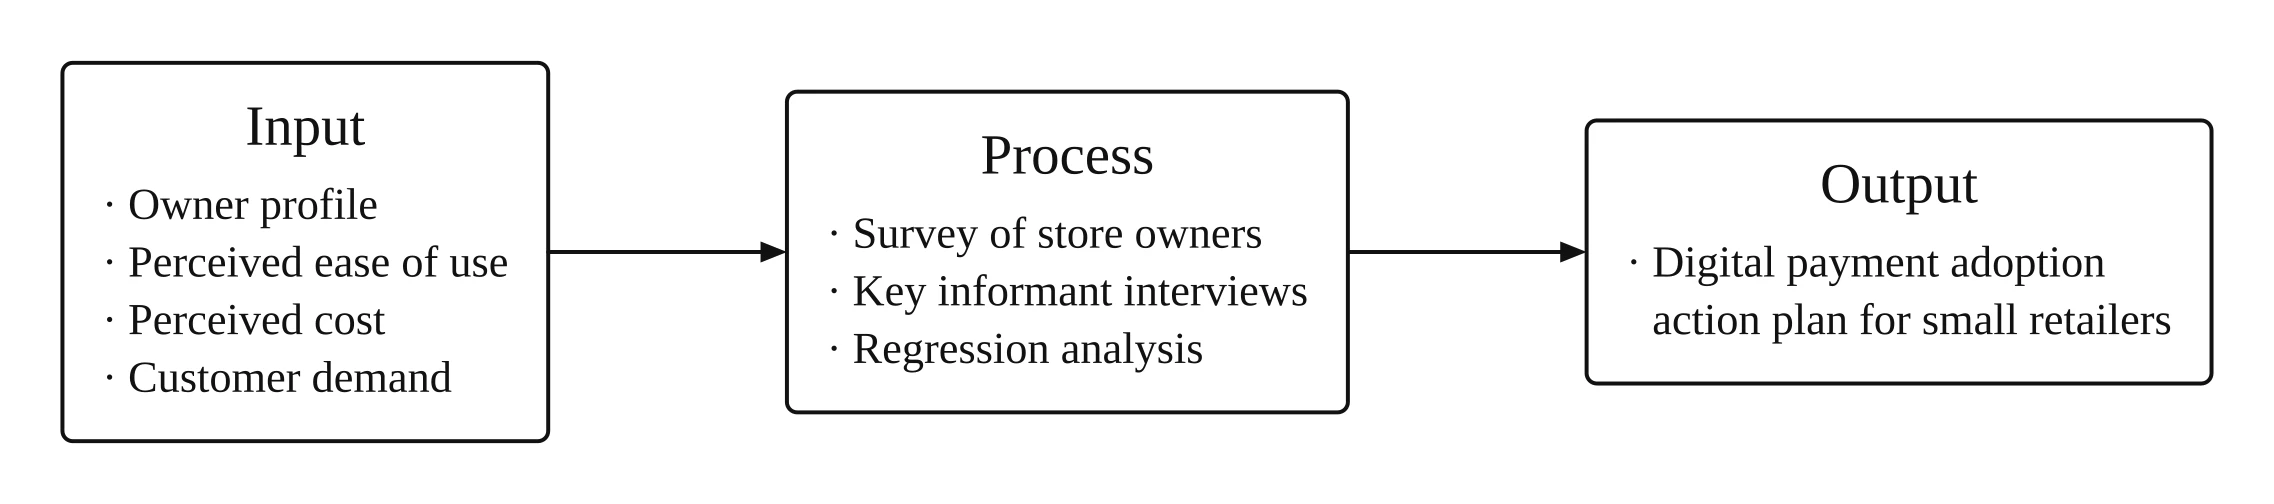
Description used: IPO model for my business administration thesis on digital payment adoption among small retail stores. Input: owner profile, perceived ease of use, perceived cost, customer demand. Process: survey of store owners, key informant interviews, regression analysis. Output: digital payment adoption action plan for small retailers.
Sample write-up (use your own figure number): Figure [n] presents the conceptual framework of the study. The input consists of the owner profile, perceived ease of use, perceived cost and customer demand. The process covers a survey of store owners, key informant interviews and regression analysis. The output is a digital payment adoption action plan for small retailers.
Open this example in the generator and swap in your own variables.
IT capstone IPO framework: web-based inventory management system
Unlike the first three examples, an IT capstone builds a system instead of studying respondents, so the IPO framework describes the build. Input lists the knowledge, software and hardware requirements; process lists the development phases and the evaluation; output is the system itself. The feedback arrow shows that evaluation results go back into the requirements.
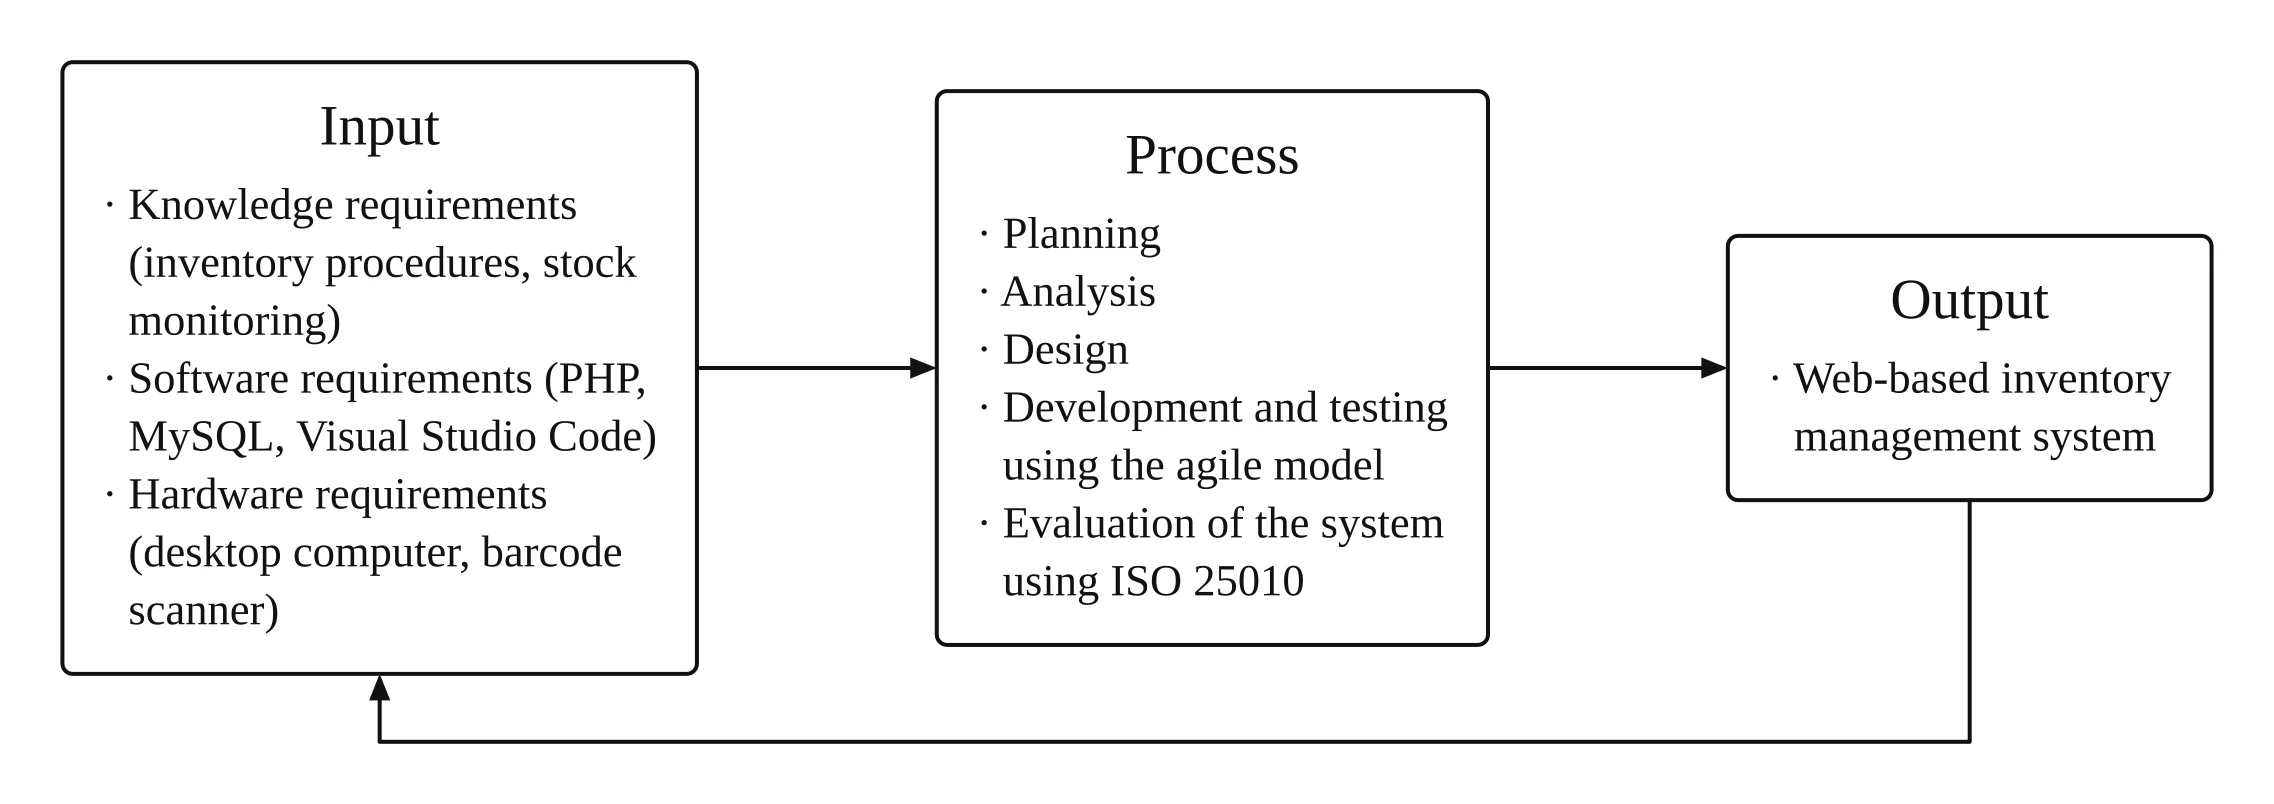
Description used: IPO conceptual framework for an IT capstone project: a web-based inventory management system for a school supply office. Input: knowledge requirements (inventory procedures, stock monitoring), software requirements (PHP, MySQL, Visual Studio Code), hardware requirements (desktop computer, barcode scanner). Process: planning, analysis, design, development and testing using the agile model; evaluation of the system using ISO 25010. Output: web-based inventory management system. Add a feedback arrow from output back to input.
Sample write-up (use your own figure number): Figure [n] shows the conceptual framework of the project. The input lists the knowledge requirements, the software requirements (PHP, MySQL, Visual Studio Code) and the hardware requirements (desktop computer, barcode scanner). The process follows the agile model through planning, analysis, design, development and testing, and evaluates the system using ISO 25010. The output is a web-based inventory management system. The feedback arrow shows that the evaluation results go back into the requirements.
Open this example in the generator and swap in your own variables.
Hospitality IPO framework: guest satisfaction in beach resorts
Back to a survey study: this hospitality management study is built on the five service quality dimensions. Listing the dimensions in brackets keeps them inside one input item, so the box stays short.
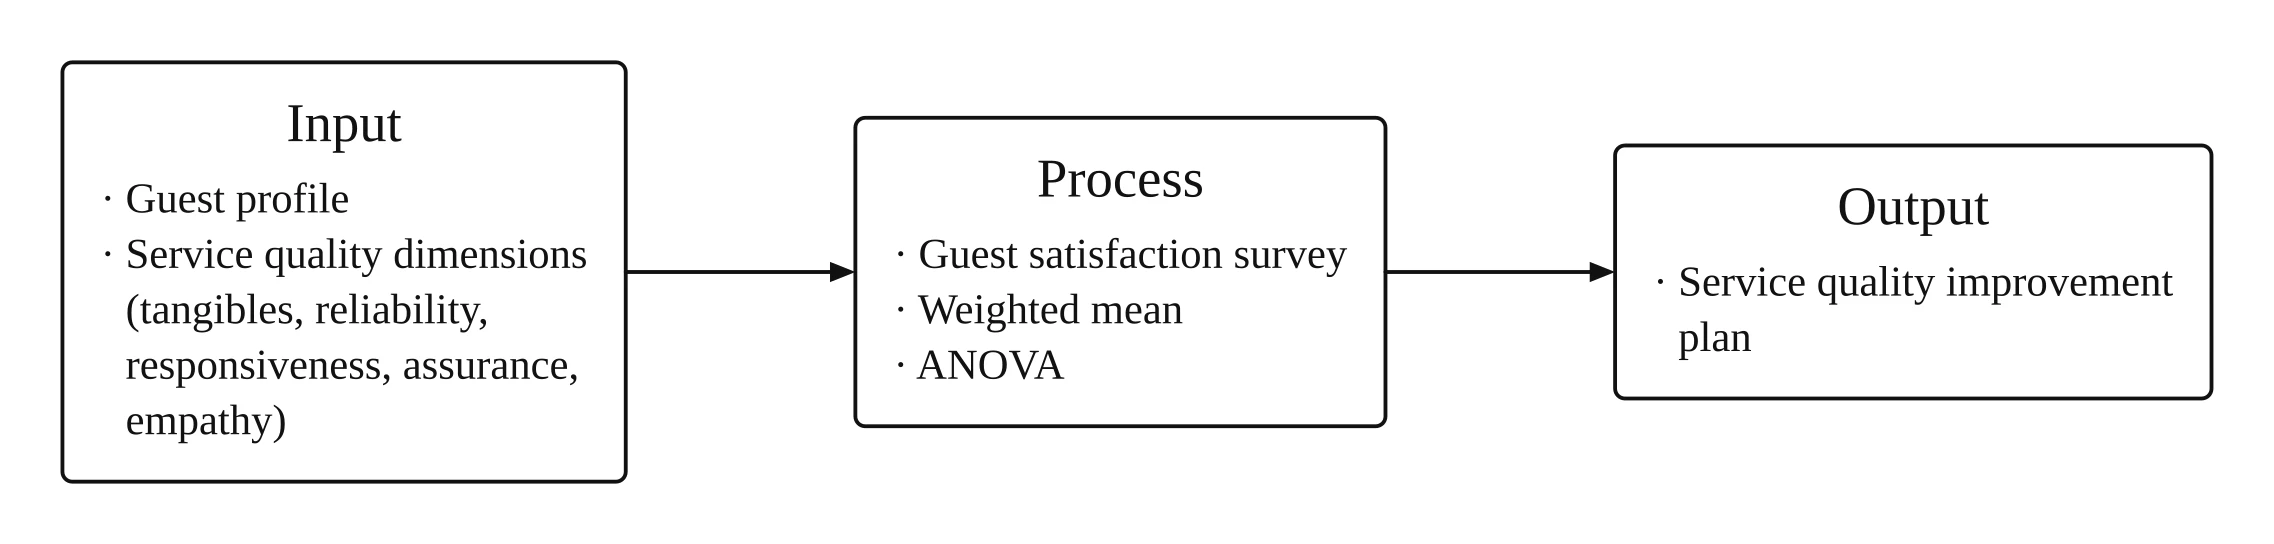
Description used: IPO framework for a hospitality management study on guest satisfaction in beach resorts. Input: guest profile, service quality dimensions (tangibles, reliability, responsiveness, assurance, empathy). Process: guest satisfaction survey, weighted mean and ANOVA. Output: service quality improvement plan.
Sample write-up (use your own figure number): Figure [n] presents the conceptual framework of the study. The input consists of the guest profile and the five service quality dimensions: tangibles, reliability, responsiveness, assurance and empathy. The process covers a guest satisfaction survey, with the data treated using the weighted mean and ANOVA. The output is a service quality improvement plan.
Open this example in the generator and swap in your own variables.
Environment IPO framework: household waste segregation in a barangay
The last example is a community study with a survey and a focus group discussion. The output is a proposed program, which is the usual output of an action-oriented thesis.
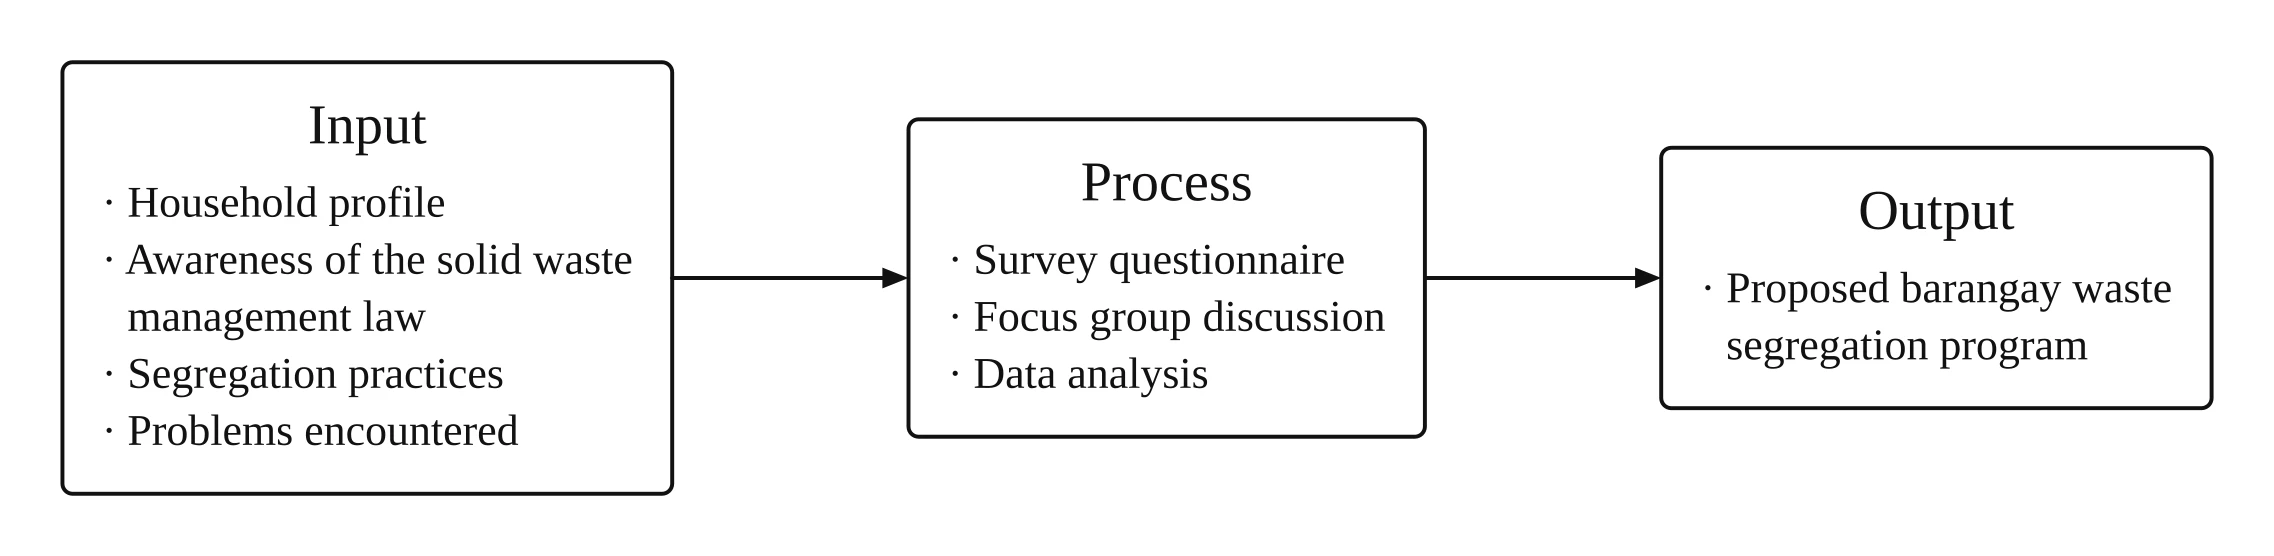
Description used: Input-process-output conceptual framework for a study on household waste segregation practices in a barangay. Input: household profile, awareness of the solid waste management law, segregation practices, problems encountered. Process: survey questionnaire, focus group discussion, data analysis. Output: proposed barangay waste segregation program.
Sample write-up (use your own figure number): Figure [n] presents the conceptual framework of the study. The input consists of the household profile, awareness of the solid waste management law, segregation practices and problems encountered. The process covers a survey questionnaire, a focus group discussion and the analysis of data. The output is a proposed barangay waste segregation program.
Open this example in the generator and swap in your own variables.
How do you make an IPO conceptual framework for your thesis?
Making an IPO conceptual framework takes six steps: list the inputs, list the process, name the output, decide on feedback, draw it and explain it.
-
List the inputs. Take them from your statement of the problem: if it asks about the respondents' profile and their level of study habits, those are your inputs. For a system, list the knowledge, software and hardware requirements.
-
List the process. Name how you will gather the data (survey questionnaire, interview, observation), how you will treat it (weighted mean, correlation, ANOVA, thematic analysis), or the development steps for a system.
-
Name the output. Write the finished thing: "Proposed study skills enhancement program", not "to propose a program".
-
Decide on feedback. Add an arrow from output back to input if your program expects it, or if the output is meant to improve the inputs.
-
Draw it. Type the three lists into the conceptual framework generator the way the descriptions above are written ("Input: … Process: … Output: …"). Code lays out the boxes and sets the items in type, so the words are not redrawn by an image model.
-
Write the explanation. Under the figure, add one paragraph that walks through the boxes in order: "Figure [n] presents the conceptual framework of the study. The input consists of… The process covers… The output is…" Each example above has one you can adapt.
How do you draw an IPO framework in Word?
In Word, go to Insert → SmartArt → Process → Basic Process to get three boxes joined by arrows, then type your input, process and output items into the boxes. For a feedback arrow, add a curved arrow from Insert → Shapes and draw it from the output box back to the input box. SmartArt shrinks the text as the lists grow, and you re-line the feedback arrow by hand whenever an item changes, so keep each item short.
To use a generated figure instead, download it as a PNG and insert it as a picture. The editable SVG keeps the text as text, so you can still fix a word inside Word; see how to insert an SVG into Word.
Common mistakes in IPO frameworks
- Objectives in the output box. The output is the thing the study produces (a program, a plan, a system), not "to determine the level of…".
- Inputs that do not match the statement of the problem. Every variable you list as input should appear in your research questions, and the other way round.
- A process box that only says "data analysis". Name the instrument and the statistical treatment, so the figure matches your methodology chapter.
- Too many items. Long sentences make the boxes tall and hard to read; keep each item to a short noun phrase and explain it in the text.
- An outcome in the output box. The output is what your study hands over (the program, plan or system). A later effect such as "improved academic performance" is an outcome your study does not measure, so leave it out of the box or mention it in the text.
How these figures were made, and what to check
Every figure on this page came out of the conceptual framework generator from the description printed under it. A text model read the description into the three boxes and their items; code then laid out the boxes and arrows and set the labels in type. The figures were not edited by hand; the images are only cropped to the figure.
What to check before you use one:
- The model's reading. The text model decides which item goes in which box. Check every item against your description.
- Language. Descriptions in Chinese, Japanese or Korean, and uploaded sketches, are drawn by an image model instead of the code layout, so proofread every label in those.
See accuracy and limits for more.
IPO conceptual framework: frequently asked questions
What is the IPO model in a conceptual framework?
It is a way of drawing a study as three boxes: input (what the study starts with, such as the respondents' profile and the variables measured), process (how the data are gathered and analyzed) and output (what the study produces, such as a proposed program). Arrows run from input to process to output, often with a feedback arrow back to input.
What is the difference between an IPO and an IV–DV conceptual framework?
An IPO framework shows the flow of the study in three boxes; an IV–DV framework shows the relationships you test between independent and dependent variables, one arrow per hypothesis. Studies that propose a program or build a system usually use IPO; studies that test hypotheses usually use IV–DV. See the comparison.
Should an IPO framework have a feedback arrow?
It is optional. Add an arrow from output back to input when your program expects one, or when the output (a program, plan or system) is meant to improve the inputs. The education and IT capstone examples show it.
Can I make an IPO conceptual framework for a capstone project?
Yes. List the knowledge, software and hardware requirements as input, the development phases and evaluation as process, and the system as output, as in the IT capstone example.
Can you use an IPO framework in qualitative research?
Yes. In a qualitative study the input is usually the participants' profile and the experience you study, the process names the interviews or focus group discussions and the thematic analysis, and the output is the themes or a proposed program. The arrows show the flow of the study, not that one variable causes another.
How do you explain an IPO conceptual framework in your defense?
Walk the panel through the boxes from left to right. Start with the input and say where each item comes from in your statement of the problem. Then explain the process, naming the instrument and the statistical treatment the way your methodology chapter does. End with the output and what it is for. If the figure has a feedback arrow, say what the output feeds back into.
Is it free to make an IPO conceptual framework?
Generating costs credits because each figure runs a text model, and watermark-free downloads, 4K and an editable SVG are paid. Plans start at $14.90 a month, and one-time credit packs start at $19.90 for 150 credits and never renew. Your first figure is free without an account and downloads as a watermarked PNG; signing up adds free credits (the amount varies by country) and daily check-in credits. You can also draw the three boxes yourself with shapes or SmartArt in Word for free, but you line up the arrows and rewrap the bullet lists by hand whenever an item changes.
Can I use these figures in my thesis?
Yes. Figures you generate are yours to use in a thesis, paper or presentation. Replace the example items with your own study's inputs, process and output first.
Draw your IPO framework from a description
Type your input, process and output; the boxes and arrows are laid out for you.
