Signaling Pathway Diagram Maker — From Text to Figure

Describe a cascade in plain English and get a labeled pathway figure with membranes, phosphorylation marks, and nuclear translocation drawn in.

300 DPI PNG and SVGActivation and inhibition arrowsFree credits on sign-up

Signaling Pathway Diagram Maker

Optional

Your first diagram is free — no sign-up needed (2K with watermark)

Describe your own cascade on the left to generate your own pathway figure

How to Make a Signaling Pathway Diagram

No node library. No manual arrow routing.

Pathway figures are slow to draw because every node has to be placed, every arrow re-routed when a step is added, and every compartment redrawn by hand. Describe the cascade instead and let the layout be generated.

1

Describe the Cascade

Write the pathway as you would explain it to a colleague: the ligand, the receptor, each kinase in order, what inhibits what, and where the final effector ends up. Naming the compartments — membrane, cytoplasm, nucleus, mitochondrion — gets them drawn as labeled regions.

2

Get a Laid-Out Pathway Figure

Nodes are placed in cascade order, activation arrows point downstream, inhibition is drawn as a blunt bar rather than an arrowhead, and phosphorylation is marked with a P badge. Receptors sit in the membrane and translocating factors cross a drawn nuclear pore.

3

Export for the Manuscript

Download a 300 DPI PNG for figure panels and slide decks, or SVG when a journal asks for vector artwork or you need to relabel a node in Illustrator. Both exports keep the labels as sharp text, not blurred pixels.

One Tool, Three Workflows

Researchers · Students · Educators

A pathway figure serves a different purpose in a manuscript, a thesis chapter, and a lecture slide. The same description produces a figure you can steer toward any of them.

Researchers

Figure 1 without a week of drafting

You already know the cascade — the time goes into placing nodes and re-routing arrows every time a reviewer asks for another step. Describe the mechanism, get a draft in under a minute, and iterate on wording instead of geometry.

  • Draft a mechanism figure in about a minute
  • Add or remove a kinase without redoing the layout
  • SVG export for journals that require vector figures
Draft a Pathway Figure

Students

Thesis chapters and journal club slides

Pathway figures are expected in a literature review but no one teaches you to draw them. Write out the cascade from your reading and get a figure that follows the same conventions your sources use.

  • No node library or drawing skill needed
  • Covers MAPK, PI3K/AKT, Wnt, NF-kappaB, JAK/STAT and more
  • Free credits on sign-up, no payment details
Make Your First Diagram

Educators

Teach the mechanism, not the software

Build the same pathway at two levels of detail — a simplified cascade for a first-year lecture and the full version with feedback loops for a seminar — from two versions of the same description.

  • Simplify or expand by rewording the description
  • Off-state and on-state panels for contrast teaching
  • 300 DPI export for printed handouts
Build a Lecture Figure

Pathway Figures Generated From Text

Six canonical cascades

Each figure below came from the description shown beside it — no node placement, no arrow routing. Open any example to load its text into the editor and change it to match your own pathway.

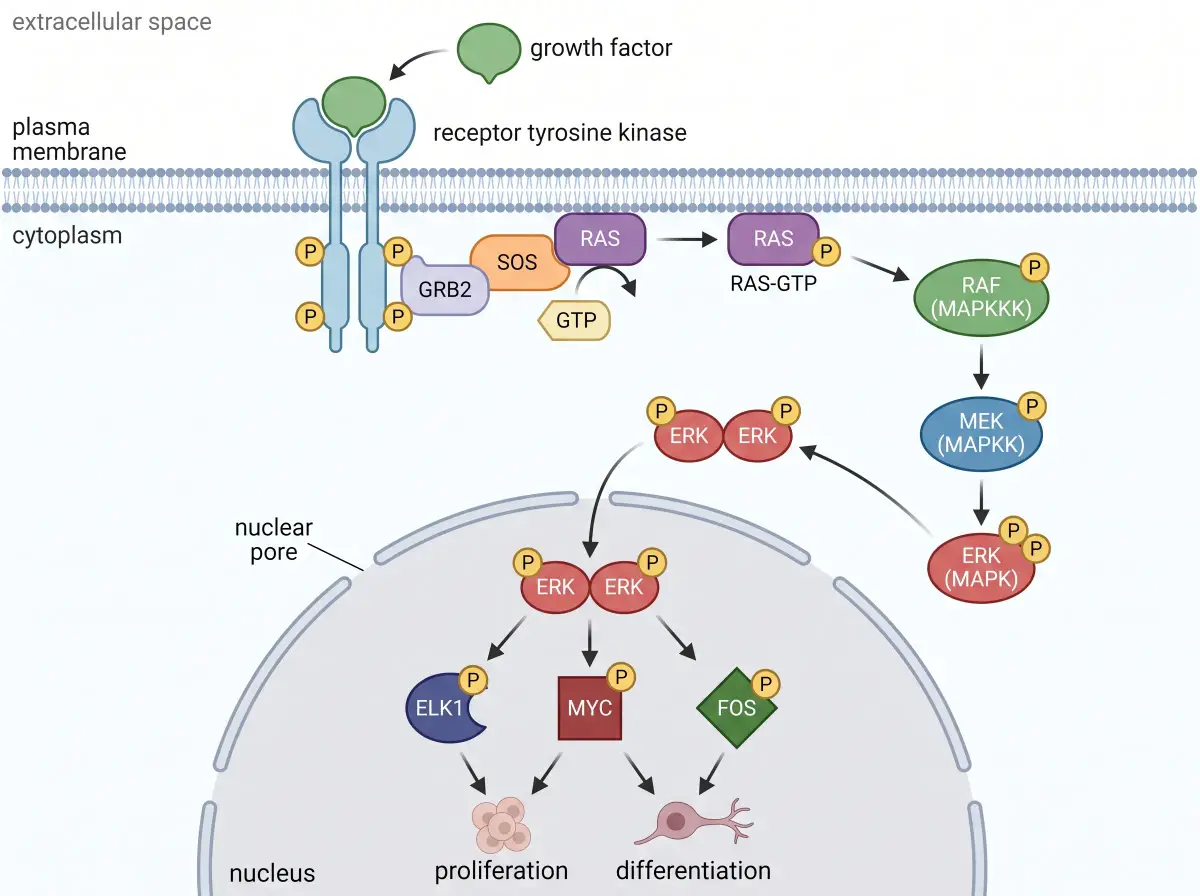
MAPK/ERK Cascade

MAPK/ERK Cascade

Growth factor to RTK to RAS-RAF-MEK-ERK, ending in the nucleus

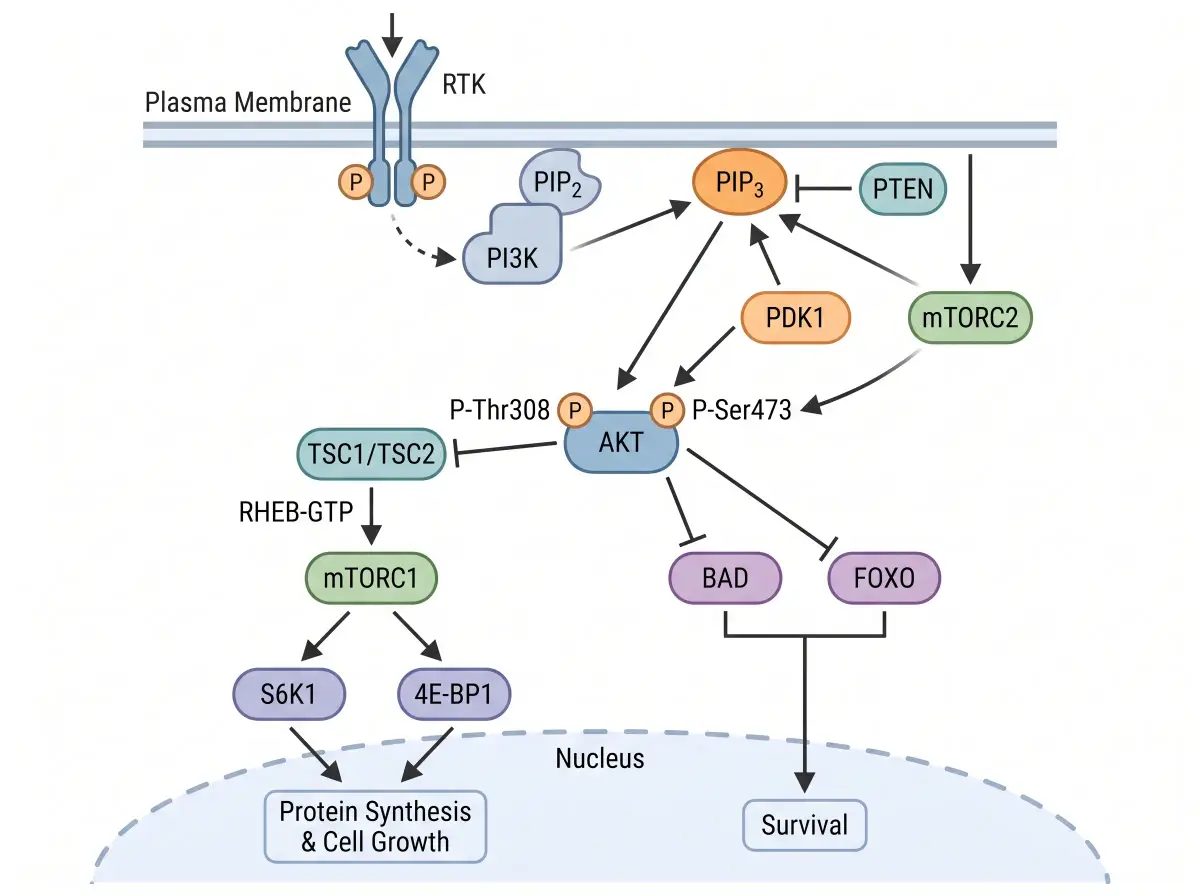
PI3K/AKT/mTOR

PI3K/AKT/mTOR

Membrane lipid second messenger through to mTORC1 and cell growth

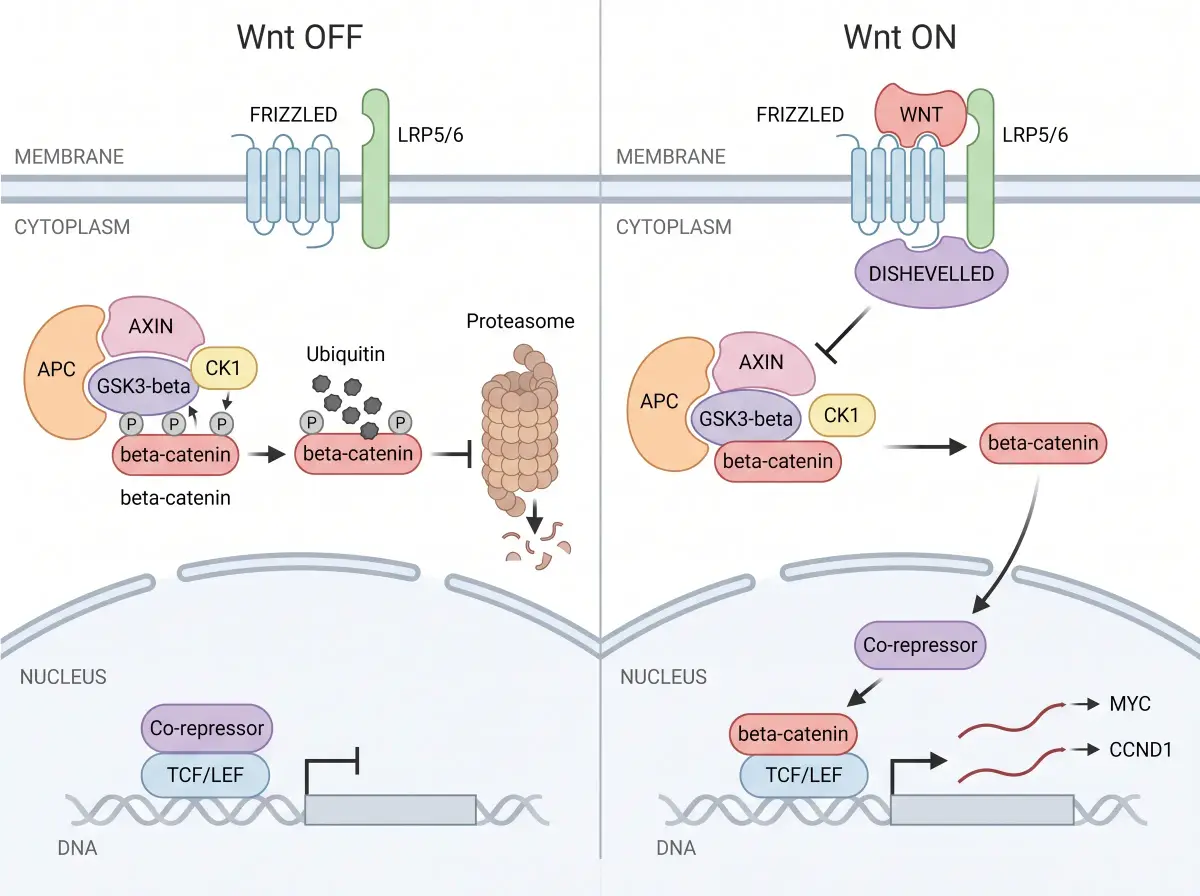
Wnt/β-Catenin

Wnt/β-Catenin

Off-state destruction complex beside the on-state nuclear output

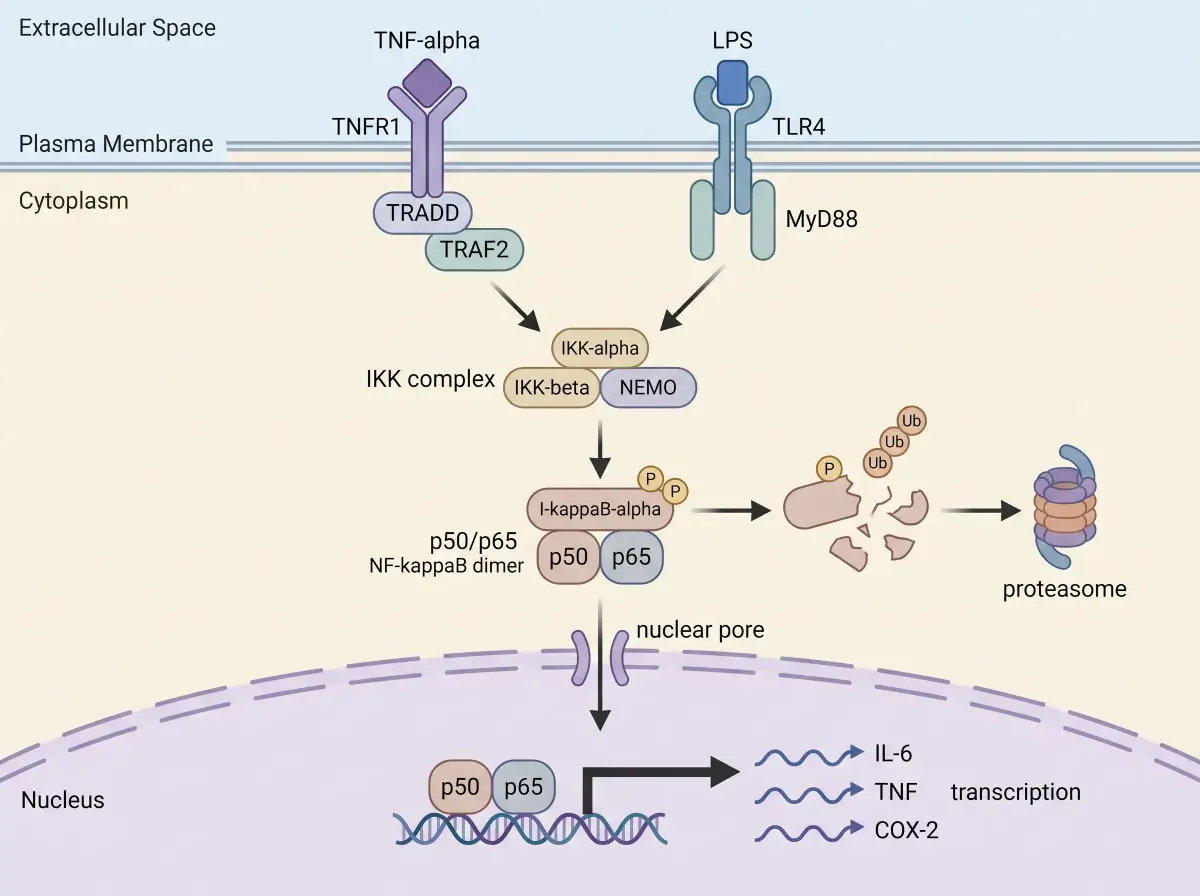
NF-κB Inflammatory

NF-κB Inflammatory

Receptor to IKK to IκB degradation and nuclear translocation

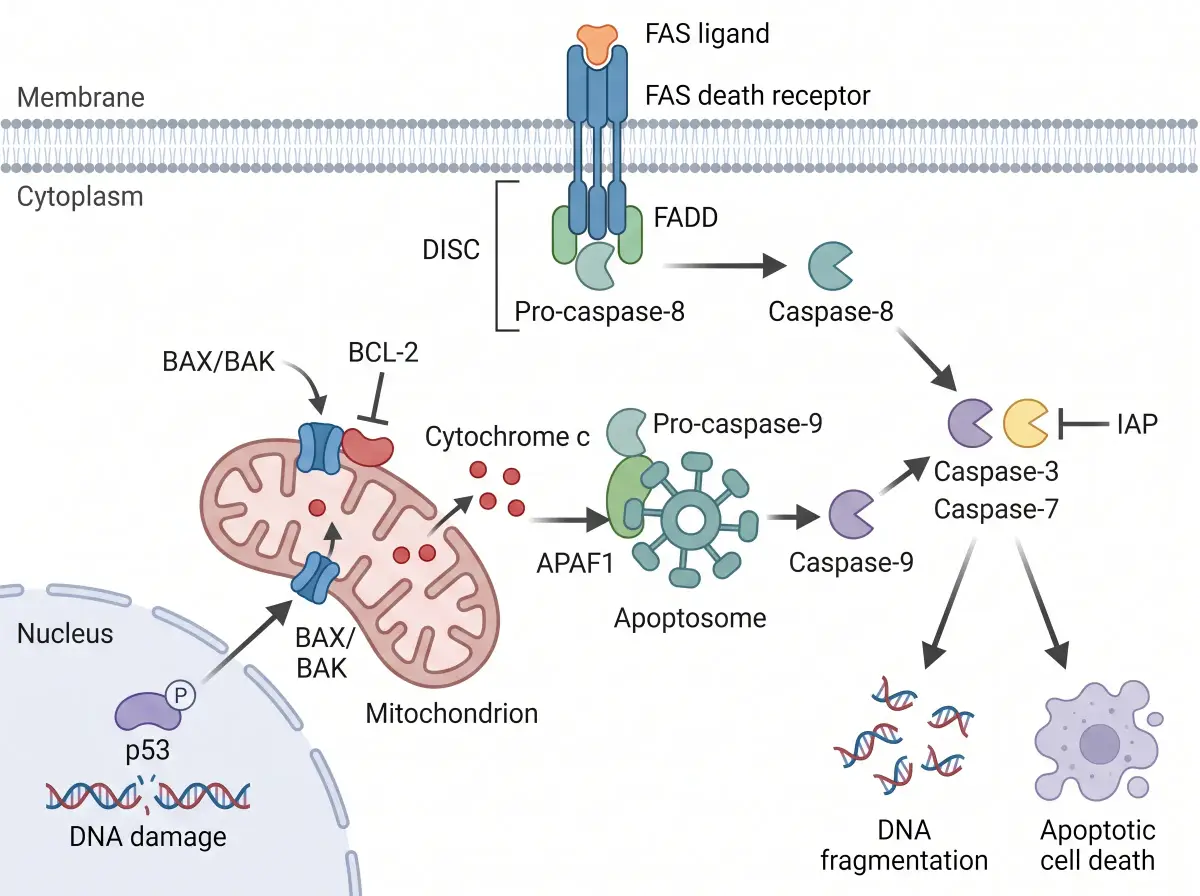
Apoptosis Pathways

Apoptosis Pathways

Extrinsic death receptor arm converging with the intrinsic mitochondrial arm

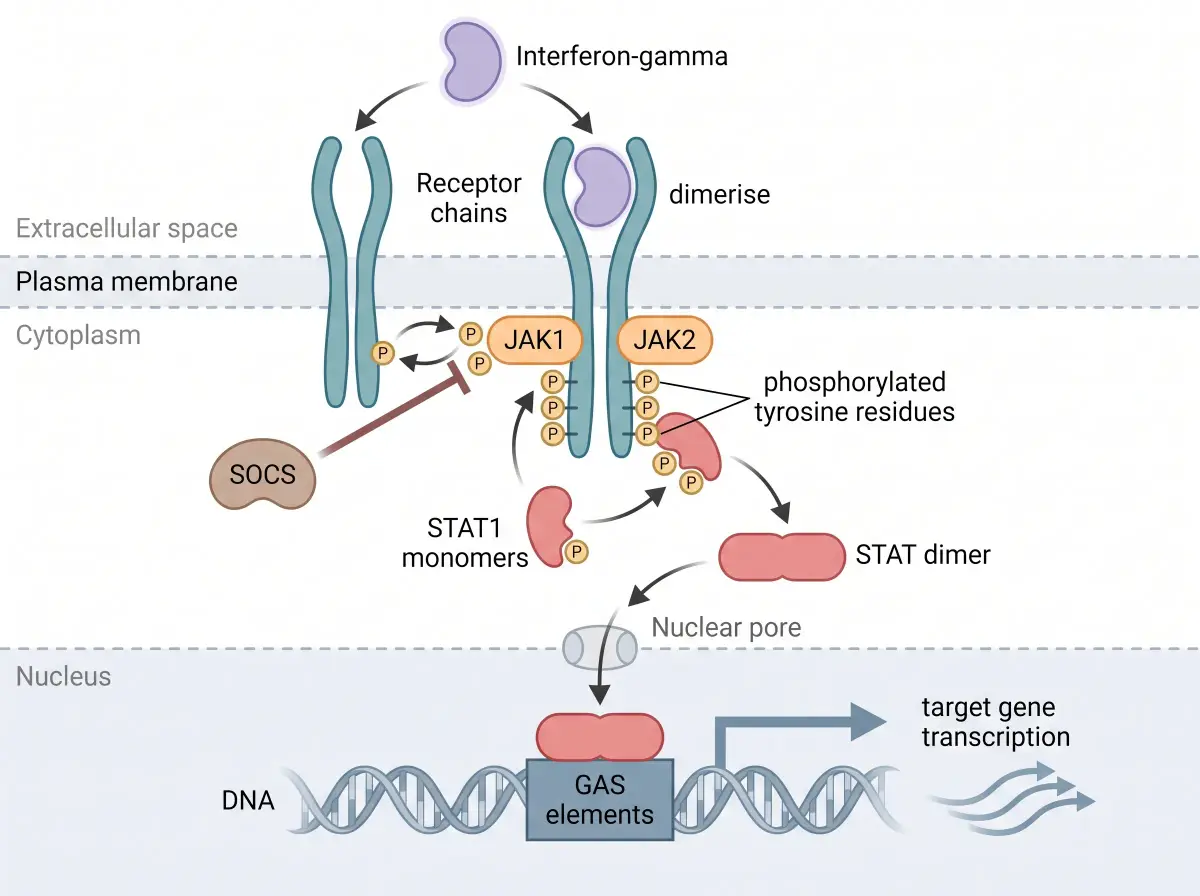
JAK/STAT Cytokine

JAK/STAT Cytokine

Cytokine receptor dimerisation through to STAT dimer gene activation

What This Signaling Pathway Diagram Maker Does Differently

Built around pathway conventions, not a generic canvas

General diagram tools give you boxes and arrows and leave the cell biology to you. The conventions a reviewer expects — inhibition bars, phosphorylation marks, compartment bands — are built into how the figure is drawn.

Notation

Activation and Inhibition Look Different

Pointed arrowheads versus blunt bars

Activation is drawn as a standard arrowhead and inhibition as a blunt perpendicular bar, the convention used in Cell, Nature and every pathway database. Write "PTEN inhibits PIP3" and the bar is drawn without you selecting a line style.
Compartments

Membranes and Nuclei as Real Regions

Receptors sit in the bilayer, not beside it

Name the compartments and they become labeled bands: extracellular space above a phospholipid bilayer, cytoplasm below it, and a nuclear envelope with a drawn pore. Receptors are embedded in the membrane and transcription factors cross the pore.

Cascades

Kinase Hierarchy Preserved

MAPKKK to MAPKK to MAPK, in order

Cascade order is read from your description and rendered top to bottom, so RAF sits above MEK and MEK above ERK. Tier labels such as MAPKKK, MAPKK and MAPK are placed alongside when you mention them.

Modifications

Phosphorylation Marked Explicitly

P badges on the residue that carries them

Phosphorylation events appear as circled P badges attached to the node being modified, and dual phosphorylation — MEK onto ERK, for example — is drawn as two marks rather than one, matching how the step is shown in review articles.

Feedback

Loops and Crosstalk Drawn In

Negative feedback routed back upstream

Mention SOCS inhibiting JAK or ERK feeding back onto RAF and the return path is drawn as a separate routed edge rather than being flattened into the main cascade, so the loop stays readable.

Export

Figure-Ready Files

300 DPI PNG and editable SVG

Export a 300 DPI PNG that holds up in a printed figure panel, or SVG when the journal requires vector artwork or you want to recolour a node and fix a gene name in Illustrator without regenerating.

Start free, upgrade when you need more

Every account gets free credits on sign-up — enough to generate and refine your first pathway figures. Upgrade for watermark-free 4K exports and a larger monthly credit balance.

Student or teacher? Apply for an education discount

Apply now

How People Actually Use It

Feedback from researchers, graduate students, and instructors who draw pathway figures as part of the job.

Dr

Dr. Hannah Whitfield

Postdoc, Cancer Cell Biology

I needed a PI3K/AKT figure for a grant resubmission with three days left. Described the axis including PTEN and mTORC1, got a usable draft, and spent the afternoon on the text instead of on arrow routing.

Pr

Priya Raghunathan

PhD Candidate, Immunology

My NF-kappaB chapter figure went through four rounds with my supervisor. Adding the TLR4 arm was a sentence edit rather than relaying half the diagram, which is why it survived four rounds.

Ma

Marcus Lindqvist

Lecturer, Molecular Biology

I generate the same Wnt pathway twice — a simplified version for the second-year lecture and the full destruction-complex version for the honours seminar. Same description, two levels of detail.

Dr

Dr. Hannah Whitfield

Postdoc, Cancer Cell Biology

I needed a PI3K/AKT figure for a grant resubmission with three days left. Described the axis including PTEN and mTORC1, got a usable draft, and spent the afternoon on the text instead of on arrow routing.

Pr

Priya Raghunathan

PhD Candidate, Immunology

My NF-kappaB chapter figure went through four rounds with my supervisor. Adding the TLR4 arm was a sentence edit rather than relaying half the diagram, which is why it survived four rounds.

Ma

Marcus Lindqvist

Lecturer, Molecular Biology

I generate the same Wnt pathway twice — a simplified version for the second-year lecture and the full destruction-complex version for the honours seminar. Same description, two levels of detail.

Dr

Dr. Hannah Whitfield

Postdoc, Cancer Cell Biology

I needed a PI3K/AKT figure for a grant resubmission with three days left. Described the axis including PTEN and mTORC1, got a usable draft, and spent the afternoon on the text instead of on arrow routing.

Pr

Priya Raghunathan

PhD Candidate, Immunology

My NF-kappaB chapter figure went through four rounds with my supervisor. Adding the TLR4 arm was a sentence edit rather than relaying half the diagram, which is why it survived four rounds.

Ma

Marcus Lindqvist

Lecturer, Molecular Biology

I generate the same Wnt pathway twice — a simplified version for the second-year lecture and the full destruction-complex version for the honours seminar. Same description, two levels of detail.

Dr

Dr. Hannah Whitfield

Postdoc, Cancer Cell Biology

I needed a PI3K/AKT figure for a grant resubmission with three days left. Described the axis including PTEN and mTORC1, got a usable draft, and spent the afternoon on the text instead of on arrow routing.

Pr

Priya Raghunathan

PhD Candidate, Immunology

My NF-kappaB chapter figure went through four rounds with my supervisor. Adding the TLR4 arm was a sentence edit rather than relaying half the diagram, which is why it survived four rounds.

Ma

Marcus Lindqvist

Lecturer, Molecular Biology

I generate the same Wnt pathway twice — a simplified version for the second-year lecture and the full destruction-complex version for the honours seminar. Same description, two levels of detail.

Signaling Pathway Diagram Maker — Common Questions

FAQ

Your First Pathway Figure, Free

Describe any cascade — MAPK, PI3K/AKT, Wnt, NF-kappaB, JAK/STAT — and get a labeled figure in about a minute. Free credits on sign-up, no card required.

Unlock all tools

One subscription unlocks every Vizcept AI diagram tool — from free body diagrams and syntax trees to biology diagrams and more.

View pricing
Featured on Findly.tools