


Who is this page for, and who should stay on FigureLabs?
This page is for graduate students and researchers whose figures are mostly boxes, arrows and words: conceptual and theoretical frameworks, PRISMA and study-design flow diagrams, experimental workflows, syntax trees.
Stay on FigureLabs if:
- your figures are life-science illustration — cells, organs, assays, mechanisms drawn in a house style;
- you want an infinite canvas where collaborators comment, and a figure you keep editing in place;
- you want an editable PPTX export so you can finish the layout in PowerPoint;
- you want to switch between ten image models on one subscription, including GPT Image and Flux.
Do FigureLabs, SciDraw AI and Vizcept use different AI?
Mostly no, and it is worth knowing before you compare gallery images.
FigureLabs publishes its model list on its own pricing page: GPT Image 2.5 (Sunburst and Flare), GPT Image 2, GPT Image 1.5, Nano Banana, Nano Banana 2, Nano Banana Pro, SeeDream 4.5, Seedream 5.0 Lite and Flux.2 Max. Vizcept's painted figures are drawn with Nano Banana Pro. These are commercial models any of us can call through an API.
So when you put the same description into two of these tools, you are mostly comparing the prompt, the pipeline around it and the price — not a private drawing engine. Two things follow:
- Gallery images prove less than they look like they do. Whoever posts the nicest example this month may simply have run the newest model a few more times.
- A difference worth paying for has to come from somewhere else — from not using an image model at all for some figure types, from what happens after the figure is wrong, or from the bill.
How much does FigureLabs cost, and what does it renew at?
FigureLabs costs $9, $16 or $45 a month billed annually — but those were promotional prices on 21 September 2026, with a countdown running on the pricing page. The same page lists what each plan costs once the promotion ends, and that is the number that matters if the figures outlast your submission.
| FigureLabs plan | First year | Then | Credits |
|---|---|---|---|
| Free | $0 | $0 | 150 one-time, plus 50 a day; 1K export; non-commercial only |
| Starter | $108 | $120 a year | 1,000 a month, plus 100 a day |
| Plus | $192 | $420 a year | 5,000 a month, plus 100 a day |
| Pro | $540 | $1,188 a year | 20,000 a month, plus 100 a day |
| Team | $20 per seat per month | Same | 5,000 per seat per month |
SciDraw AI was also discounting that day: $20 a month becomes $15 billed yearly, $40 becomes $25, $80 becomes $40, and a one-time Lifetime licence is $1,999.
Vizcept has no promotional year. Subscriptions are $14.90, $29.90 and $59.90 a month (or $106.80, $216 and $432 a year) for 300, 900 and 2,700 credits a month. Credit packs are $19.90 for 150 credits, $39.90 for 450 and $99.90 for 1,200; they are valid for 365 days and there is nothing to cancel. A 2K figure costs 5 credits, a 4K figure 8.
What does a thesis's worth of figures cost?
A framework chapter, a PRISMA diagram, two study-design figures and the regenerations they take is roughly 40 to 60 generations spread over a few months — but rarely every month.
At Vizcept a 2K figure costs 5 credits, so a 450-credit pack is about 90 generations for $39.90, and it runs out rather than renewing. On a subscription you pay for the months you don't submit anything, which for a thesis is most of them.
| What you pay | Vizcept 450-credit pack | FigureLabs Starter | SciDraw AI Standard, yearly |
|---|---|---|---|
| First year | $39.90, one payment | $108 | $180 |
| Second year, if you still need it | $39.90 when you buy another | $120 | $180 |
| If you stop for four months | $0 | You either keep paying or lose the plan | You either keep paying or lose the plan |
| Included generations | About 90 at 2K | 1,000 credits a month plus 100 a day | 300 credits a month, about 60 images |
Heavy, continuous use flips this around: if you make figures every week, a monthly plan with daily refresh credits is better value than buying packs, and FigureLabs' daily credits are generous. Count your tries, not your final figures — every regeneration costs credits everywhere.
How do FigureLabs, SciDraw AI and Vizcept compare?
Side by side, with the prices from above condensed into one line each.
| Tool | What it is | Cost | Can you publish? | Best for |
|---|---|---|---|---|
| FigureLabs | AI illustration studio on an infinite canvas: illustrations, flowcharts and plots, ten image models, PPTX and SVG export | Free tier, non-commercial. Paid from $9/month billed annually, renewing at $120 a year | Paid plans only; they include a publication certificate | Life-science illustration, canvas editing, PPTX handover |
| SciDraw AI (sci-draw.com) | AI figure platform with a tool catalogue: graphical abstracts, posters, PRISMA, frameworks | Free tier that already allows publication. Paid from $15/month billed yearly; Lifetime is a one-time $1,999 | Yes, on every plan including free | Trying a lot of figure types cheaply; labs that want a lifetime licence |
| BioRender | Drag-and-drop editor with an illustrator-drawn icon library, plus an AI add-on | Free plan: up to 3 figures, no publication. Individual (academic) $35/month billed yearly | Paid only | Labs that live in the icon library |
| Vizcept | Describe a figure, get PNG or SVG; 16 figure types, three of them laid out by code | Free: one generation, watermarked preview. Credit packs $19.90 to $99.90, valid 365 days, no renewal; subscriptions from $14.90/month | Yes, on every plan, including figures made with credit packs | Frameworks, PRISMA, workflows and syntax trees; paying for one thesis and stopping |
Also worth naming, because the search results mix them up: scidraw.io is a free library of hand-drawn scientific illustrations released under CC BY, run by physicists. It is not the same thing as sci-draw.com (SciDraw AI), the paid AI tool in the table.
What does "laid out by code" change about the figure?
On Vizcept, conceptual frameworks, syntax trees and sentence diagrams do not go to an image model at all. A language model reads your description and returns a structure — the constructs, their roles, and which path each hypothesis sits on — and then code places the boxes and draws the arrows. Everything else, including PRISMA, is still painted by an image model (how Vizcept draws figures).
What that buys you is not prettier output. It is that a few things stop being a matter of chance:
- a moderator arrow points at the path it was told to moderate, at its midpoint;
- every construct the analysis returned is on the figure, and the names are typeset from the analysis rather than painted;
- the same description produces the same figure twice;
- the SVG download keeps real text you can edit in Illustrator or Inkscape, instead of outlines traced from a picture.
Here is the difference on one description: health literacy predicting medication adherence through perceived susceptibility and self-efficacy, with perceived social support moderating the self-efficacy path, three control variables, and hypotheses labelled H1 to H6.
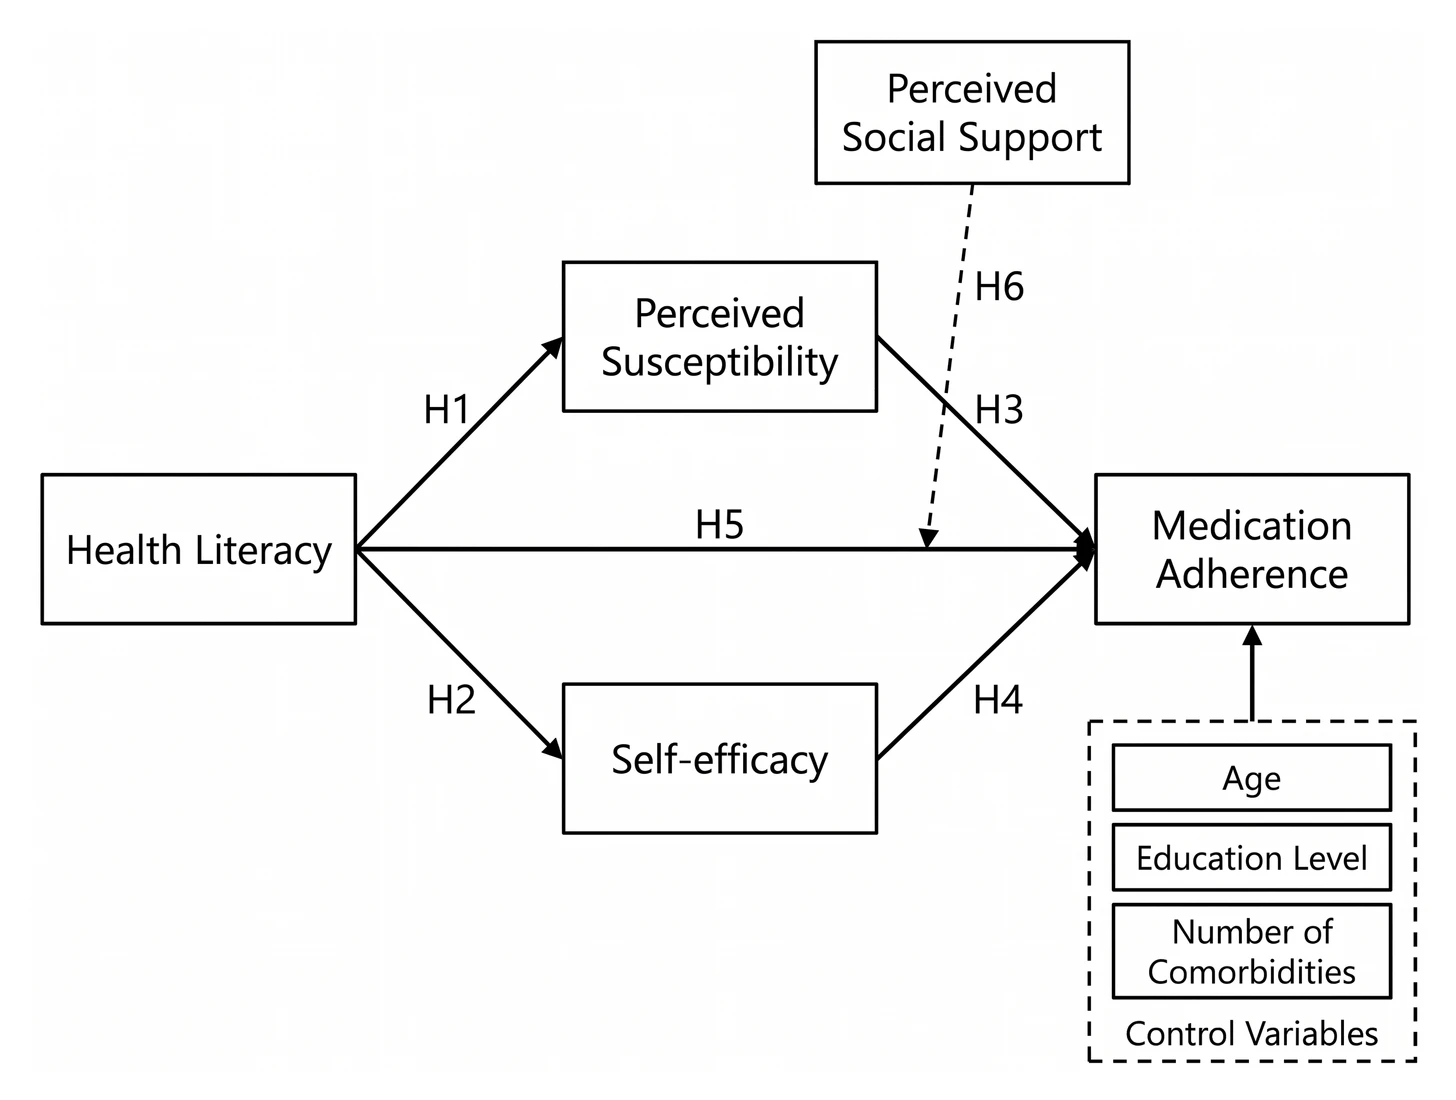
Painted by an image model. It is the better-looking figure, and every construct name is spelled correctly. But the dashed moderator arrow ends on the direct health literacy → medication adherence path, not on the self-efficacy → medication adherence path the description named.
We ran it through the image-model path ten times on 21 September 2026. The wording was right in all ten; the moderator arrow was not:
| Version of the description | Runs | Moderator arrow on the wrong path |
|---|---|---|
| Two mediators, moderator, three control variables | 4 | 3 |
| The same, without the control variables | 3 | 1 |
| One mediator, one moderator, no hypothesis labels | 3 | 0 |
The pattern is the one you would expect: the busier the figure gets around the dependent variable, the more often the arrow lands on the wrong line. A reader skimming your framework chapter will not notice. A reviewer who tests your moderation hypothesis will.
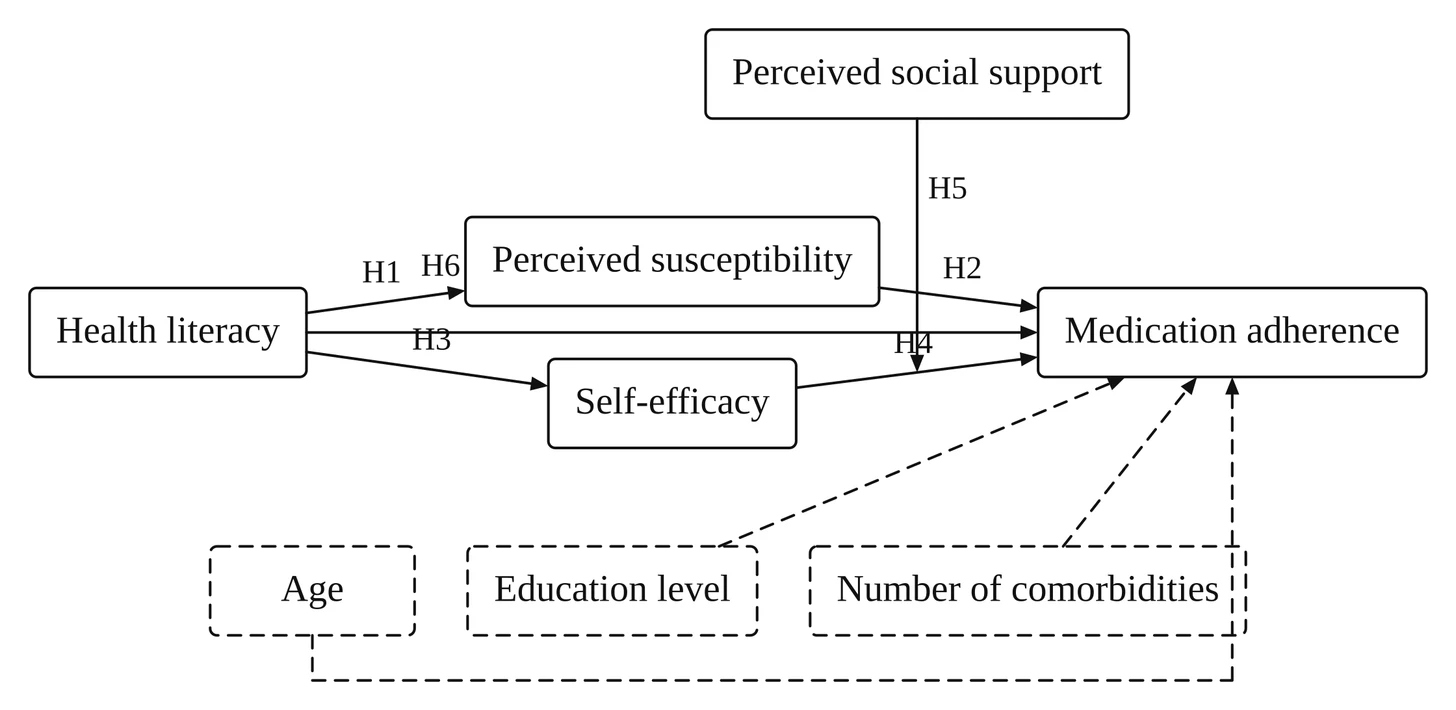
Laid out by code. Plainer, and on a model this dense the hypothesis labels sit closer together than we would like — if that bothers a reviewer, open the SVG and drag the labels, or move the hypothesis numbers into the caption, which is what most journals prefer anyway. But the moderator arrow is on the path it was told to moderate, the control variables are dashed, and the next run produces the same figure.
What this does not do is check the analysis. In this example the language model added a direct health literacy → medication adherence path that the description never asked for — a normal thing to hypothesise, and still not what we wrote. Read the constructs and the arrow directions against your own chapter before the figure goes anywhere.
What happens when a coauthor asks you to change one label?
This is where AI figure tools differ most, and it is worth knowing before you commit a chapter to one.
In an editor — BioRender, or FigureLabs' canvas — you click the label and retype it. Nothing else moves. FigureLabs also exports an editable PPTX, so the last round of changes can happen in PowerPoint. Vizcept has neither: no canvas, no PPTX.
In Vizcept there are two routes, and they are not equivalent:
- Change the description and regenerate. For the three code-laid-out types this is the one to use: the figure is rebuilt from the analysis, so the new label is typeset, not painted, and nothing else in the figure drifts. Each regeneration costs credits, and every version stays in the workbench so you can go back.
- Mark the figure and describe the fix. This sends the picture to an image model, which repaints the whole thing. It is the faster route for a painted figure. But on a framework that was laid out by code, one round of mark-and-fix turns the construct names back into painted text — which is exactly the thing that can come back misspelled. If the figure matters, re-describe rather than mark up.
Exporting it into a manuscript: figures from the code-laid-out types download as SVG with real, editable text in it, so Illustrator or Inkscape can change each word. Painted figures also download as SVG, but that file is traced from the image, so the text is outlines — you can recolour and rescale it, not retype it. Putting the SVG into Word, PowerPoint or LaTeX covers the mechanics, and turning supervisor comments into a revised figure covers what each kind of comment is actually asking for.
What is the best free tool for scientific figures?
There isn't one best tool; there is a best tool per figure. Free first:
- Icons and illustrations you arrange yourself: Bioicons (about 2,800 open-source science icons) and Servier Medical Art (CC BY 4.0, credit Servier) with Inkscape. scidraw.io is the physics-flavoured equivalent, also free and CC BY.
- Boxes, arrows and flow diagrams: draw.io in the browser, or PowerPoint if you already have it. Slower than describing a figure, and nothing can go wrong that you didn't do yourself.
- Free tiers of AI tools: SciDraw AI's free plan allows publication (10 credits on signup, 5 a day). FigureLabs' free plan does not — it is non-commercial. Vizcept's first figure is free and the preview is watermarked.
And on the question people actually type — which AI tool is best for scientific figures — the honest answer splits by figure type, not by vendor:
| What you are drawing | Where to start |
|---|---|
| Cells, organs, assays, mechanisms | BioRender's icon library, or FigureLabs' illustration mode |
| Conceptual or theoretical frameworks, syntax trees, sentence diagrams | Vizcept, because these are laid out by code rather than painted |
| PRISMA and other flow diagrams with counts in them | Any of these will paint it; check every number by hand whichever you pick |
| A graphical abstract for an Elsevier journal | None of them — Elsevier's policy bars general-purpose AI image tools here |
| Statistical plots from your own data | Your analysis software: R, Python, Prism, Excel. An AI tool should not be drawing data you collected |
Where does Vizcept not fit?
- Life-science illustration. Cells, organs, assays and mechanisms in a consistent house style are what BioRender's icon library and FigureLabs' illustration mode are for. Vizcept paints those with the same general image model as everyone else, and has no icon library behind it.
- Canvas editing and teams. There is a workbench for versions of one figure, but no infinite canvas, no collaborator comments and no PPTX export.
- Graphical abstracts for Elsevier journals. Elsevier's policy bars general-purpose AI image tools from graphical abstracts. Springer Nature's group guidance puts content created from text prompts, or without verifiable source data, in its red zone — which is what any of these tools does. The publisher policy table quotes each publisher and links the original, and publication rights covers who owns what.
- Experimental data figures. Western blots, micrographs and anything that stands in for data you collected are off the table at every publisher, and Vizcept is not the tool for them.
FigureLabs alternative questions
What is FigureLabs?
FigureLabs (figurelabs.ai) is an AI scientific figure tool: you describe or upload material, it generates illustrations, flowcharts and plots on an infinite canvas, and you export PPTX, SVG or PNG. It runs on commercial image models it lists on its pricing page, including GPT Image 2.5, Nano Banana Pro and Flux.2 Max.
How much does FigureLabs cost?
On 21 September 2026 the promotional prices were $9, $16 and $45 a month billed annually, and the same page listed the standard renewal as $120, $420 and $1,188 a year. The pricing section above has the full table, including the free plan's limits.
Is there a free FigureLabs alternative?
Several, with different limits. SciDraw AI gives 10 credits on signup plus 5 a day and allows publication on the free plan. FigureLabs' own free plan is non-commercial. Vizcept gives one free generation and watermarked previews; downloads need a paid plan or a credit pack from $19.90. For icons you arrange yourself, Bioicons and Servier Medical Art are free under open licences.
Is SciDraw the same as scidraw.io?
No, and the search results mix them up. scidraw.io is a free library of hand-drawn scientific illustrations under CC BY. SciDraw AI at sci-draw.com is a paid AI figure tool with a free tier, monthly plans from $15 a month billed yearly, and a one-time $1,999 lifetime option.
Can I publish figures made with these tools?
Rights-wise, yes on the paid tiers: FigureLabs grants publication rights on paid plans and issues a certificate, SciDraw AI allows publication on every tier, and Vizcept gives you the figure on every plan. Whether a given journal accepts an AI-assisted figure is a separate question, and it depends on the publisher and the kind of figure — the policy table sets out what each one says.
Which tool is better for a conceptual framework or a PRISMA diagram?
For a conceptual or theoretical framework, Vizcept lays the figure out with code, so the moderator arrow lands on the path you named and the SVG keeps editable text. For PRISMA, everyone including Vizcept paints the figure with an image model, so check the counts by hand and make sure the numbers add up before you submit.
Will these tools train AI on my unpublished research?
Each one publishes an answer, and they are not the same. FigureLabs states on its pricing page that it never uses private uploads, text or prompts to train its models and does not share them. Vizcept does not train models on your descriptions or figures either, and because the drawing is done by outside providers, publication rights names them and quotes what each one says about training and retention — including the one whose terms are looser than ours. Whatever you pick, read that page before you paste anything embargoed or confidential.
Put your framework in and see what it draws
The first figure is free, without an account. Credit packs start at $19.90 and never renew.