
Who is this for?
This page is for master's and PhD students writing a proposal, thesis or dissertation — mostly in education, nursing, management, psychology and the social sciences, plus STEM students who need a method or study-flow figure. Typical situations:
- your supervisor keeps asking for "the model" from Chapter 2, and SmartArt can't draw a moderator pointing at a path;
- the proposal defense is in two weeks and the figure is on version 9;
- you pay for tools yourself and don't want a subscription that keeps billing after you graduate.
It is not the right tool if you need data plots from your results (use R, Python, SPSS or GraphPad), photographs or micrographs of your experiments, or detailed anatomical illustration — see what it doesn't do.
Which thesis figures can Vizcept draw?
Vizcept draws six kinds of thesis figure. Conceptual frameworks, logic models, CONSORT diagrams and syntax trees are typeset by code, so labels and counts match what you wrote; PRISMA diagrams and other schematics are drawn by the image model and need proofreading.
| Figure | Where it goes in a thesis | How Vizcept draws it | Start here |
|---|---|---|---|
| Conceptual framework or hypothesis model (IV, DV, mediators, moderators, controls, H1–Hn) | Chapter 2 or 3; proposal | Typeset by code: a text model reads the roles, code places the boxes, arrows and H labels | Conceptual framework generator |
| Theoretical framework or logic model | Chapter 2; evaluation studies | Typeset by code | Theoretical framework examples, logic model examples |
| CONSORT participant flow diagram | Methods and results of a trial | Typeset by code from your counts | CONSORT flow diagram generator |
| PRISMA flow diagram | Systematic review or scoping review chapter | Drawn by the image model — check every number | PRISMA flow diagram generator |
| Syntax trees (linguistics) | Analysis chapters | Typeset by code; X-bar and minimalism, traces and movement arrows | Syntax tree generator |
| Study-design flowcharts, workflows, other schematics | Methods | Drawn by the image model — check every label | AI diagram maker |
"Typeset by code" means the names, H labels and counts are placed by code from what you wrote, so they are spelled the way you spelled them. The analysis behind them — which variable mediates, which arrow points where — is still read by a model, so check it against your hypotheses (how accuracy works).
What do the figures look like?
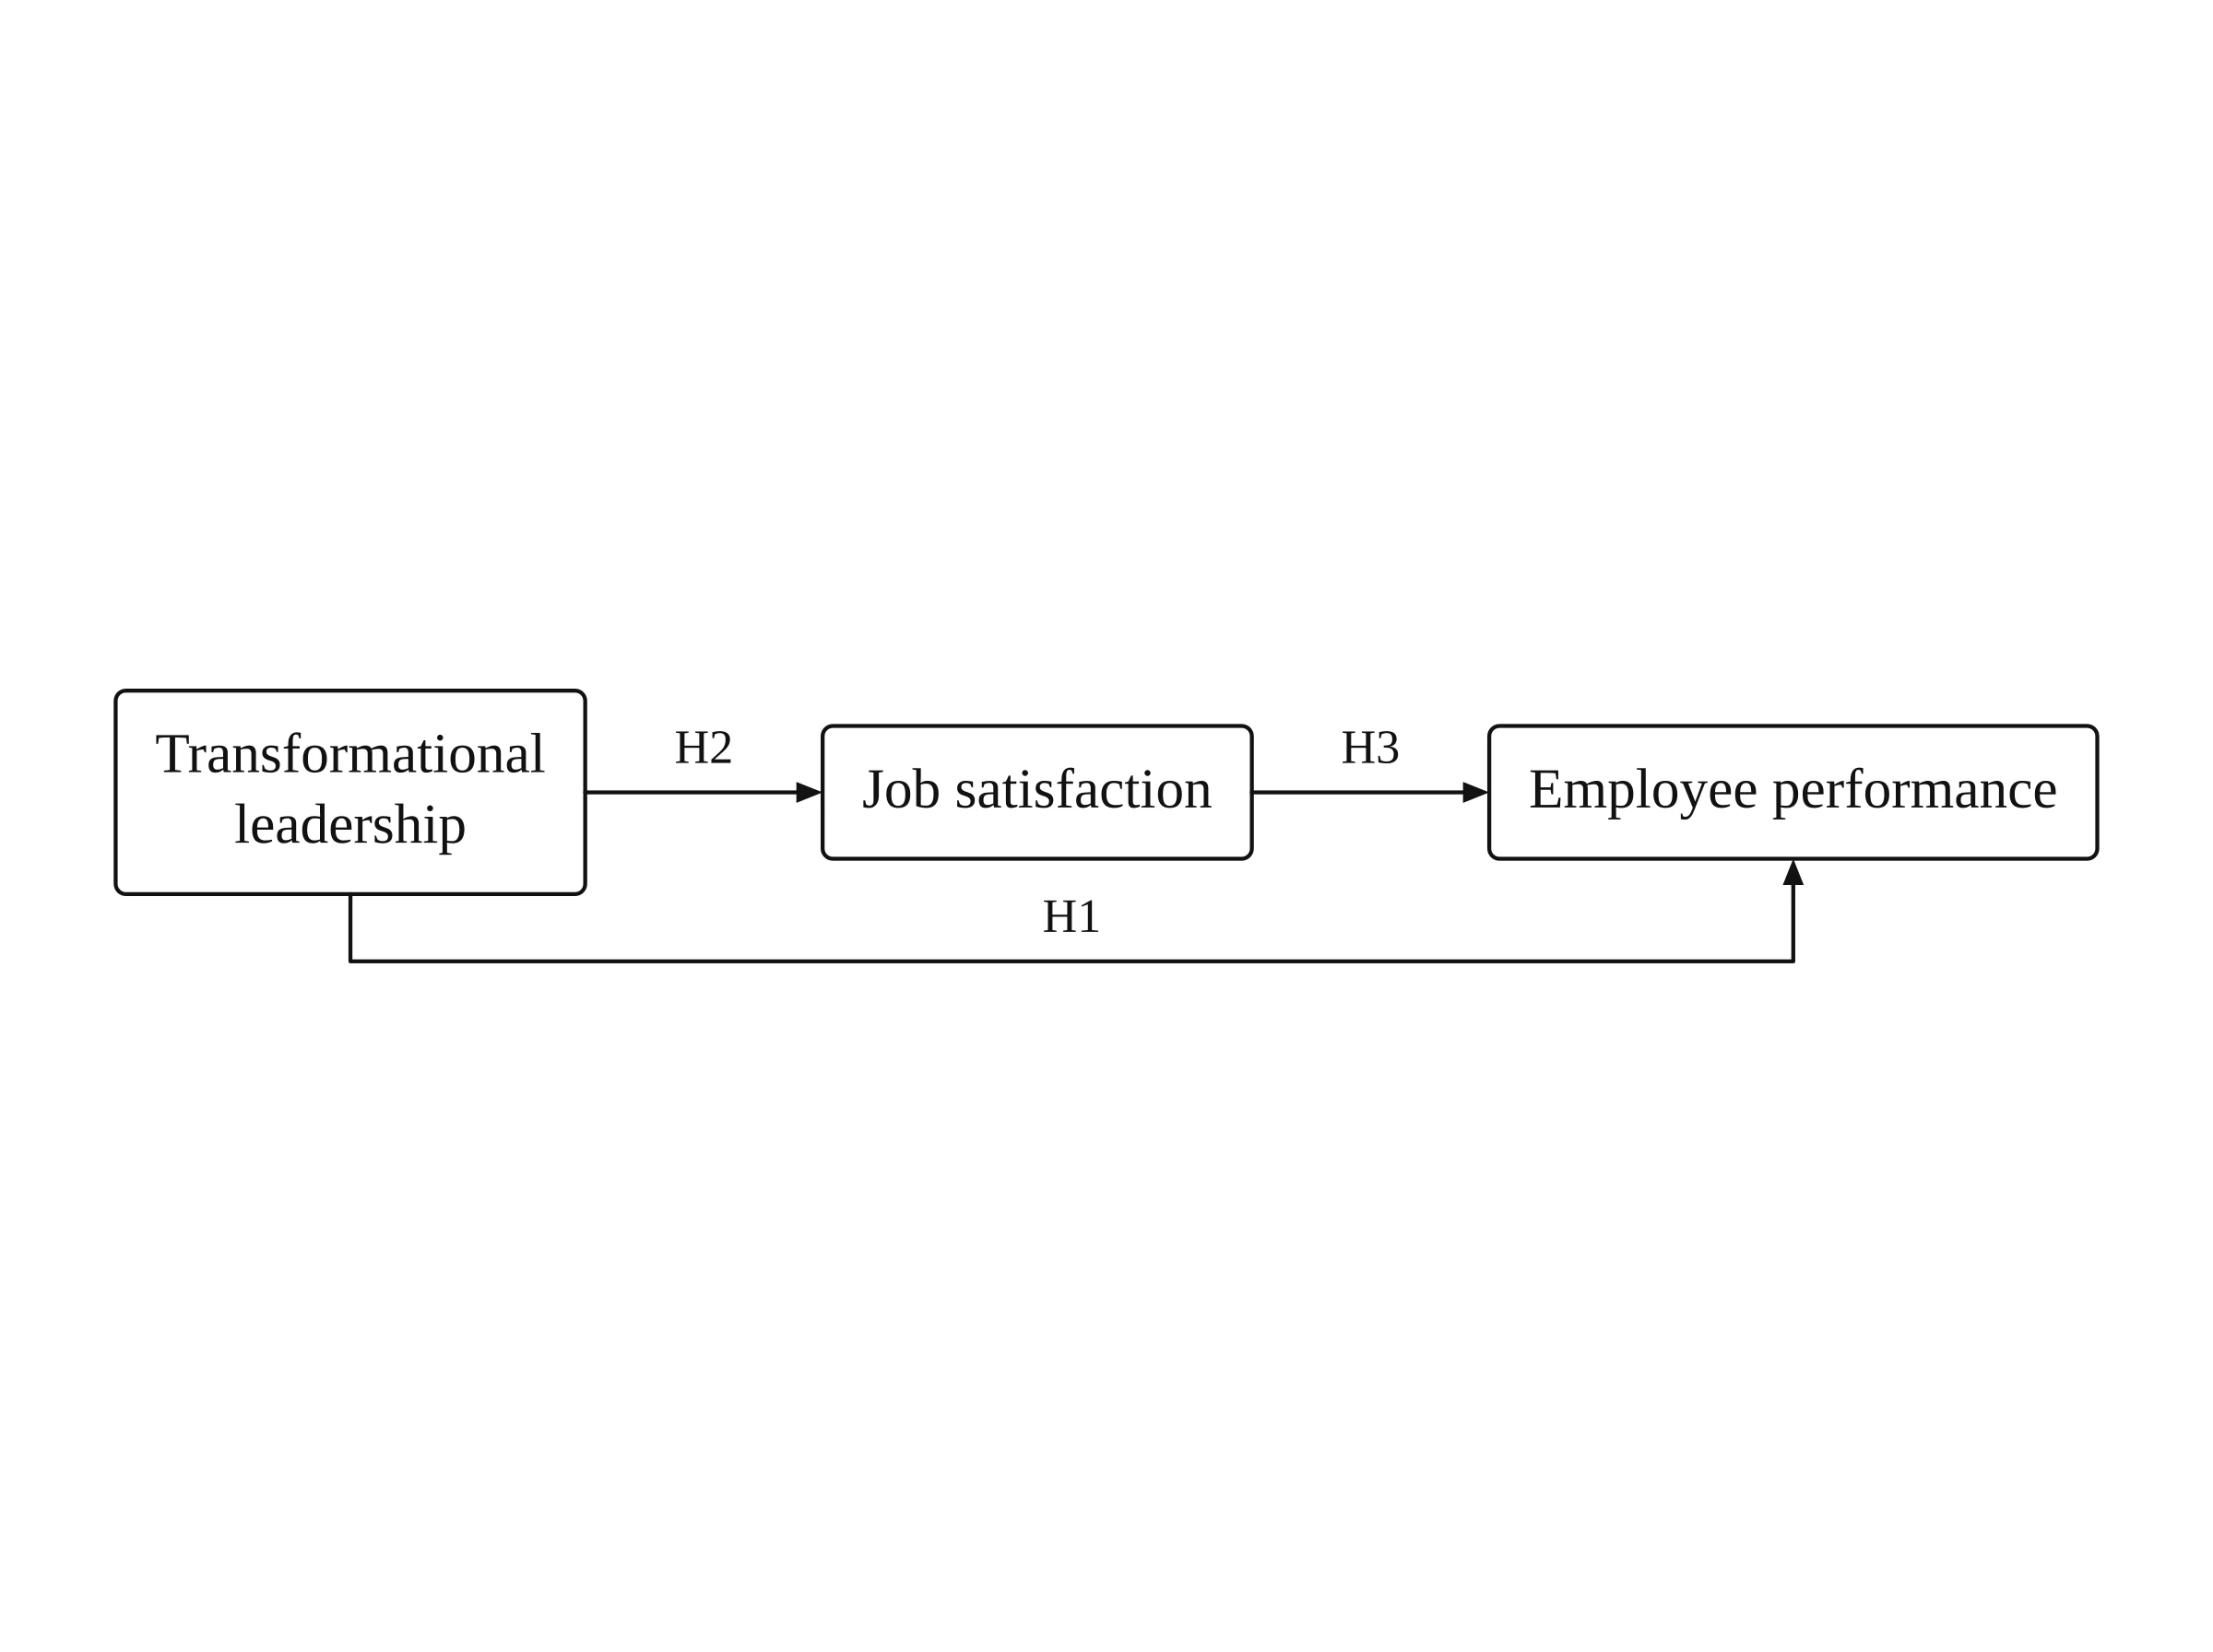
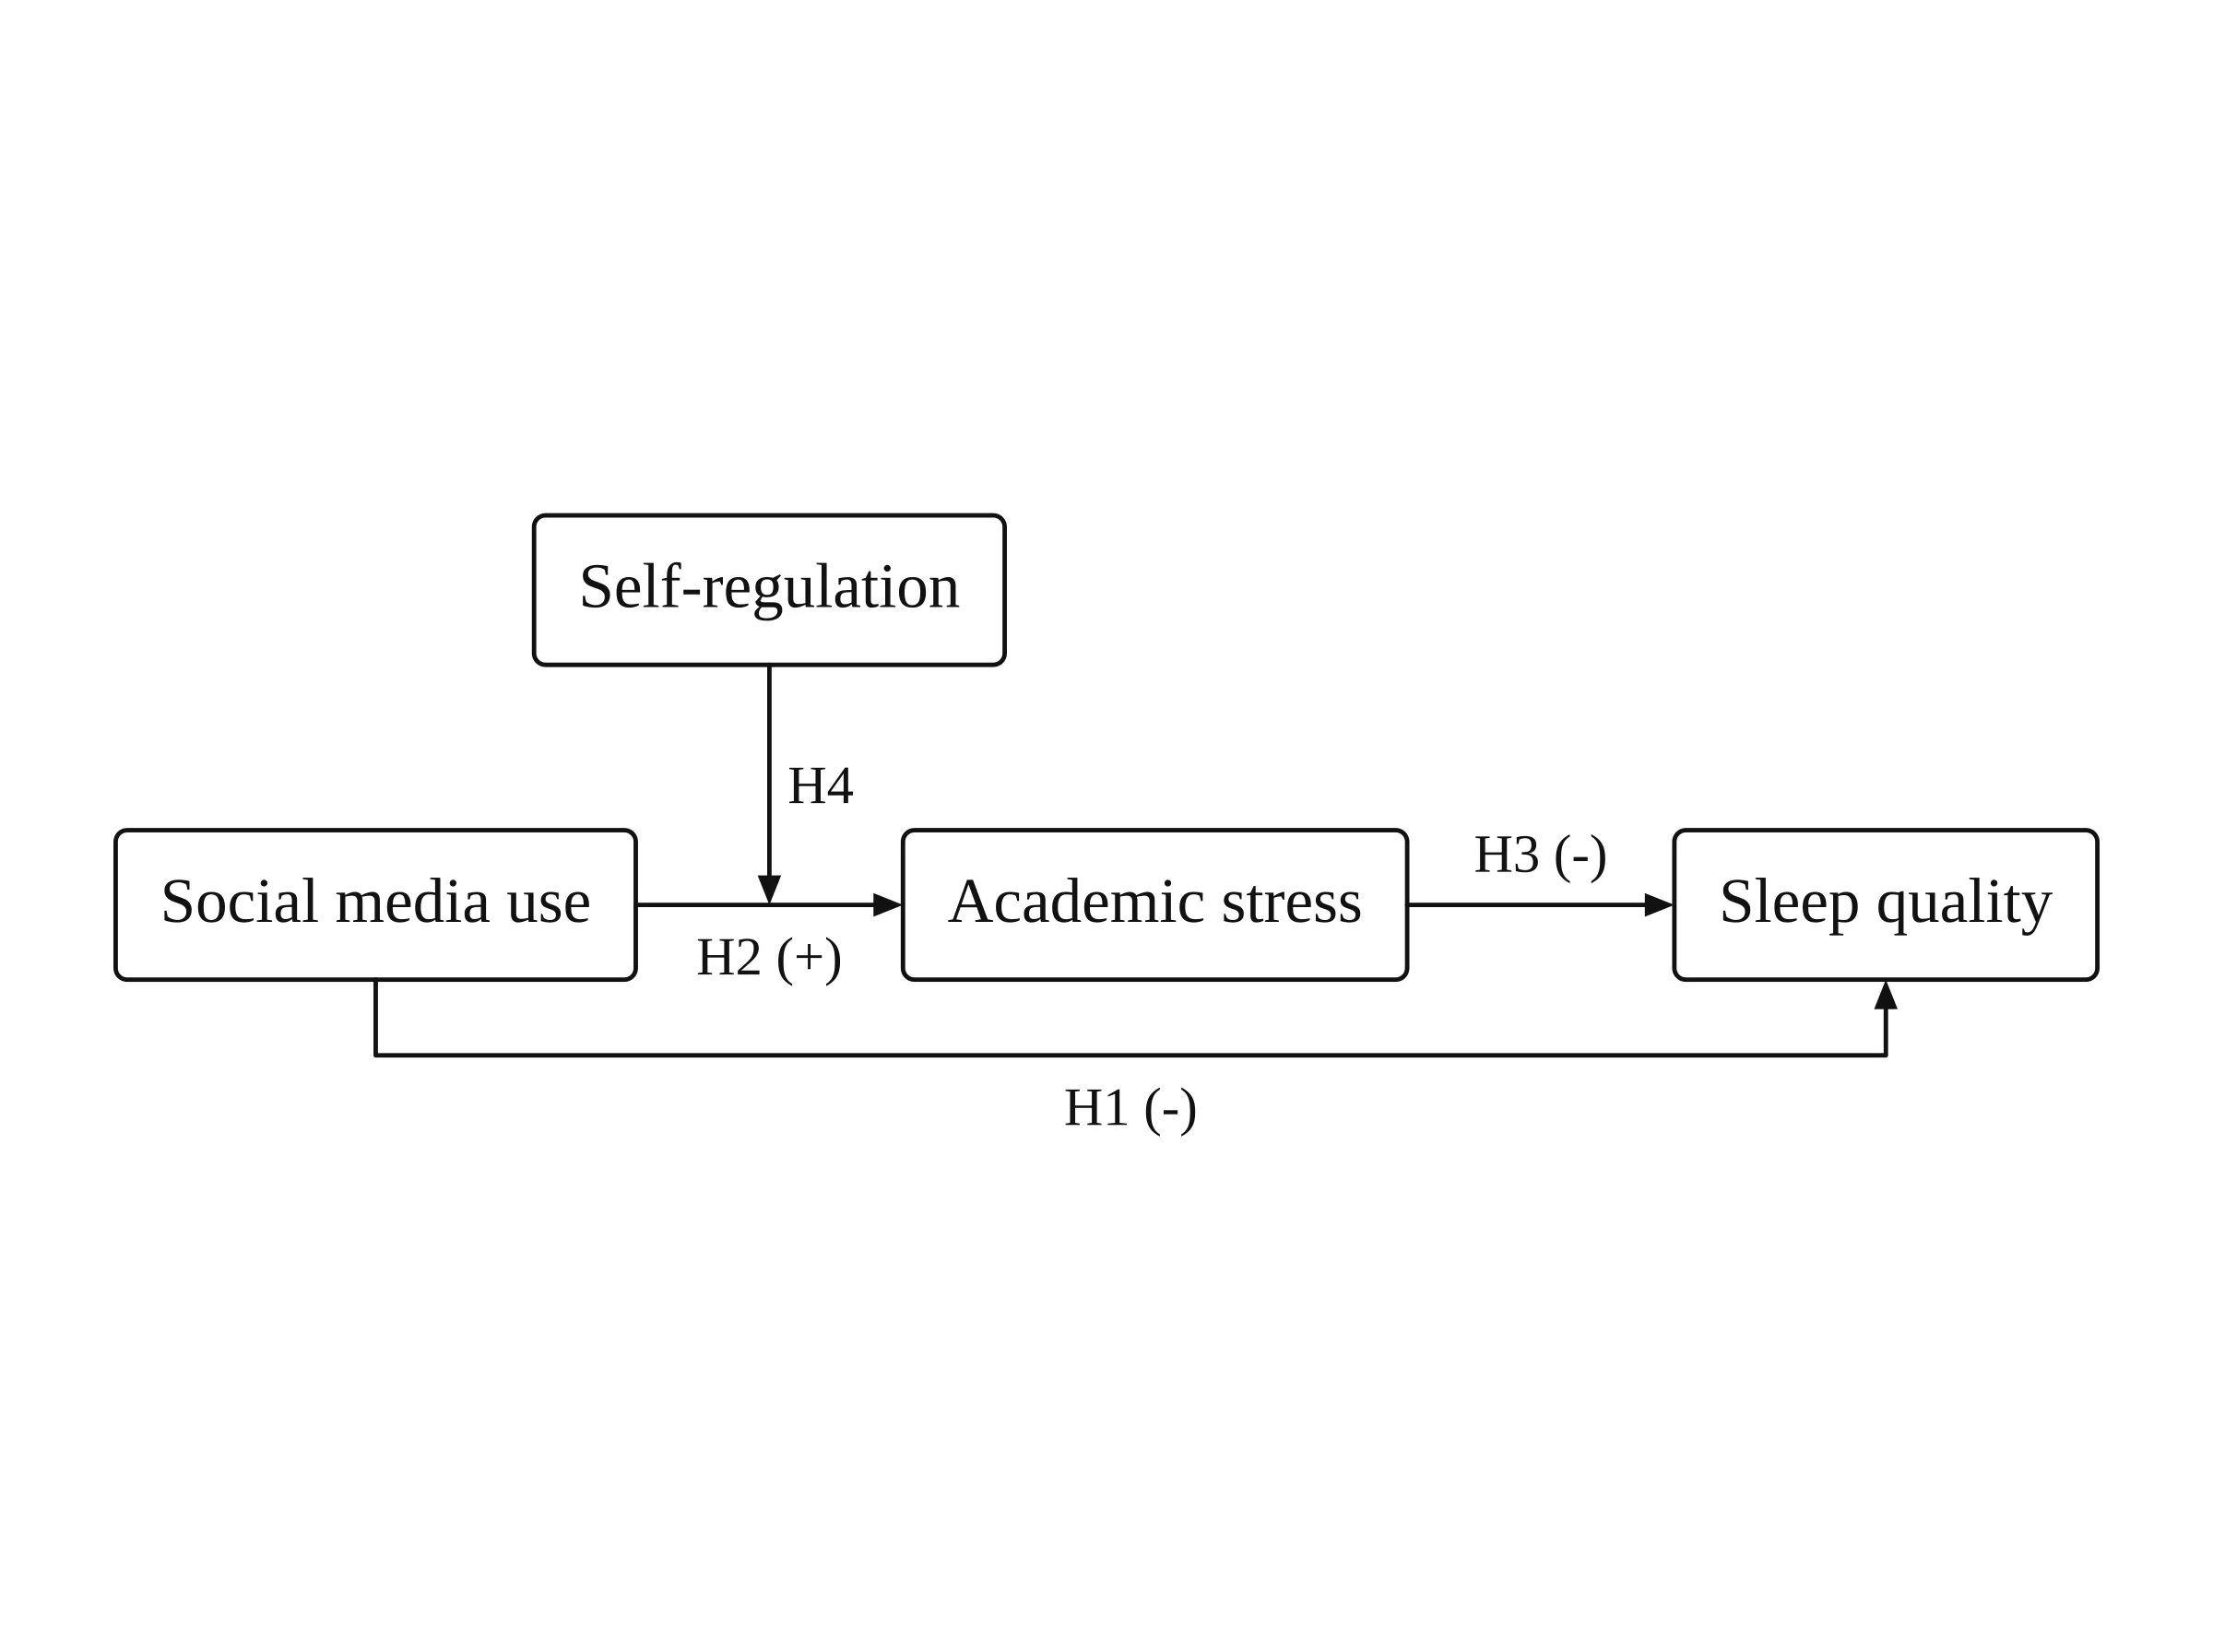
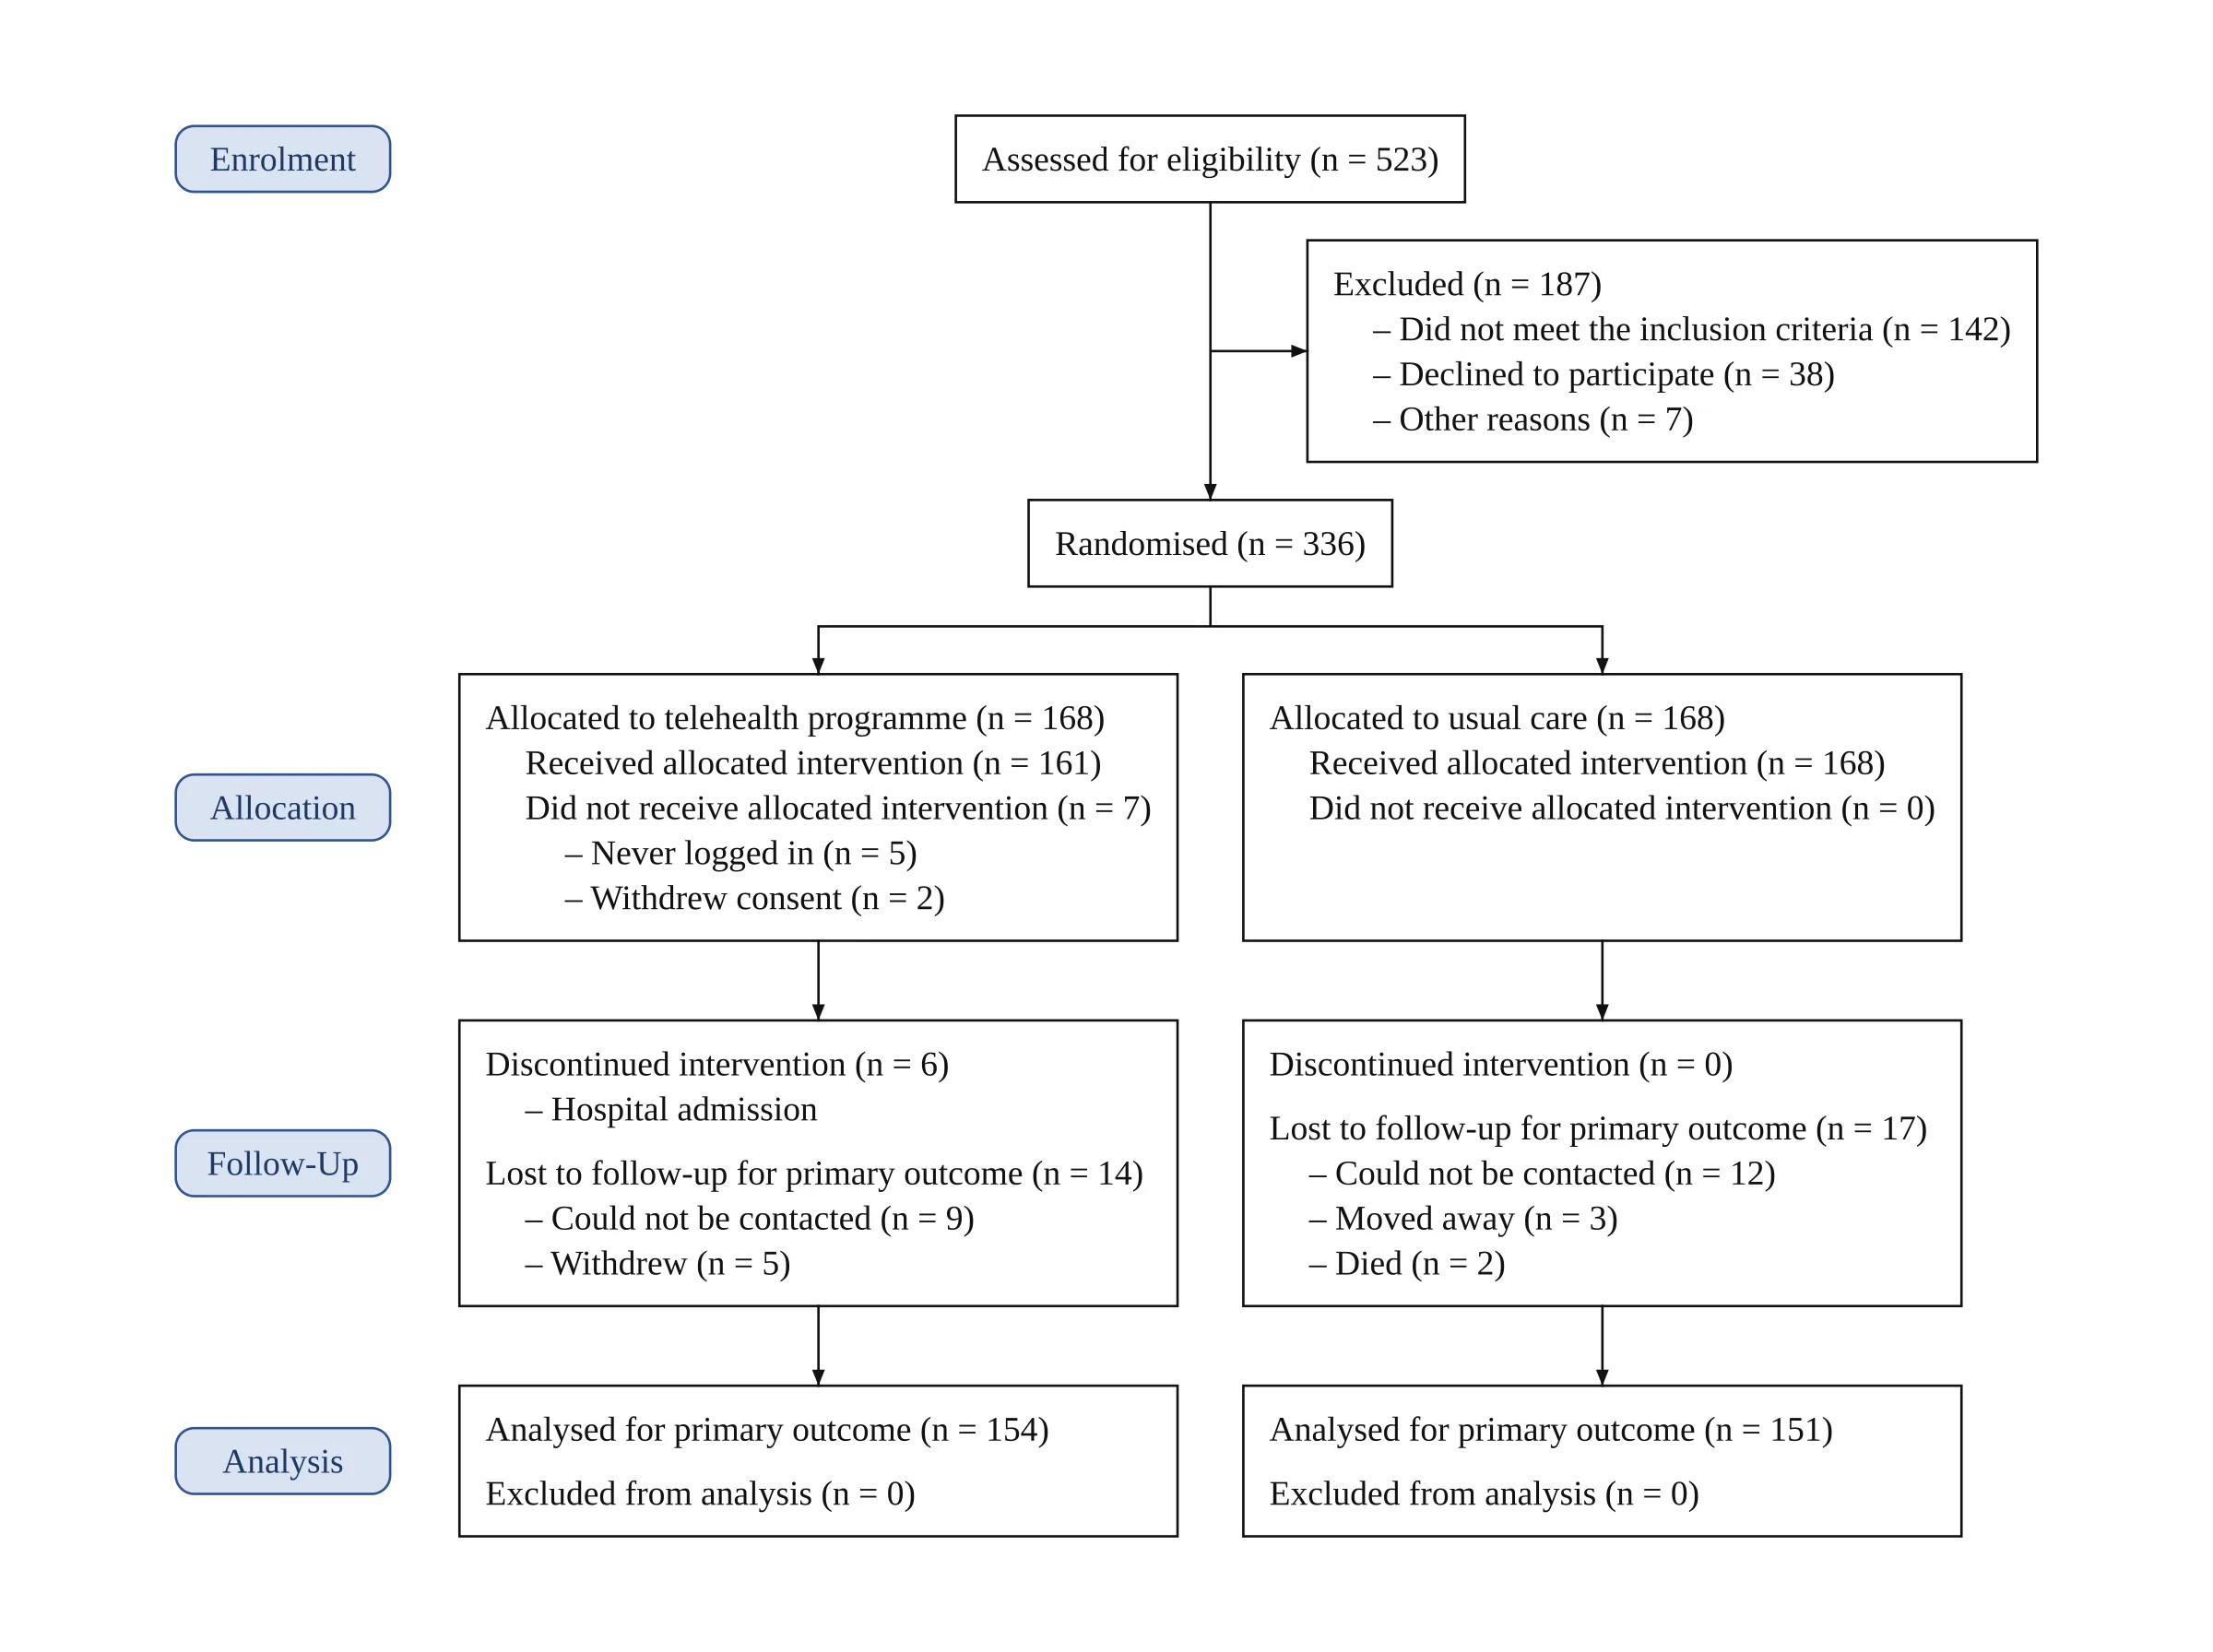
The first two figures came from the conceptual framework generator and the third from the CONSORT generator, each typeset by code from one description.
Mediation model. What we typed: "Conceptual framework showing mediating effect of job satisfaction on the relationship between transformational leadership (independent variable) and employee performance (dependent variable), with direct path (c), indirect path (a x b), and all three hypotheses labeled"
Moderated mediation model. What we typed: "Conceptual framework for a master's thesis: social media use (independent variable) increases academic stress (mediator), and academic stress lowers sleep quality (dependent variable). Social media use also has a direct negative effect on sleep quality. Self-regulation moderates the path from social media use to academic stress. Label the hypotheses H1 to H4."
CONSORT flow diagram. From the CONSORT flow diagram generator, typeset by code from a paragraph of participant counts: 523 assessed, 187 excluded with reasons, 336 randomised to a telehealth programme or usual care, then losses and analysis numbers for each group. Every count in the boxes comes from that paragraph.
Paste a description like these with your own variables into the conceptual framework generator. Before a figure goes into your thesis, check that each construct has the role you meant, that every hypothesis sits on exactly one arrow, and that the arrow directions match Chapter 2. If you are unsure whether your variable is a mediator or a moderator, the mediator vs moderator guide has a three-question test and diagrams of both.
More examples by field: conceptual framework examples, CONSORT examples.
How do you try it before paying?
Open the conceptual framework generator, paste your variables and hypotheses, and generate. Your first figure needs no account. Code-typeset figures usually come back in under half a minute; image-model figures take about a minute. Check the draft against Chapter 2, then sign up if you want to keep revising.
How do you revise the figure after supervisor comments?
Framework figures rarely survive the first meeting. Here is a worked example we ran on 18 October 2026 with the same pipeline as the live tool (text model reads the roles, code draws the figure); the figures are not edited by hand. The comment is a typical one, not a quote from a real supervisor.
Version 1. We typed: "online learning readiness (independent variable) and academic self-efficacy (independent variable) both predict academic performance (dependent variable). Label the hypotheses H1 and H2."
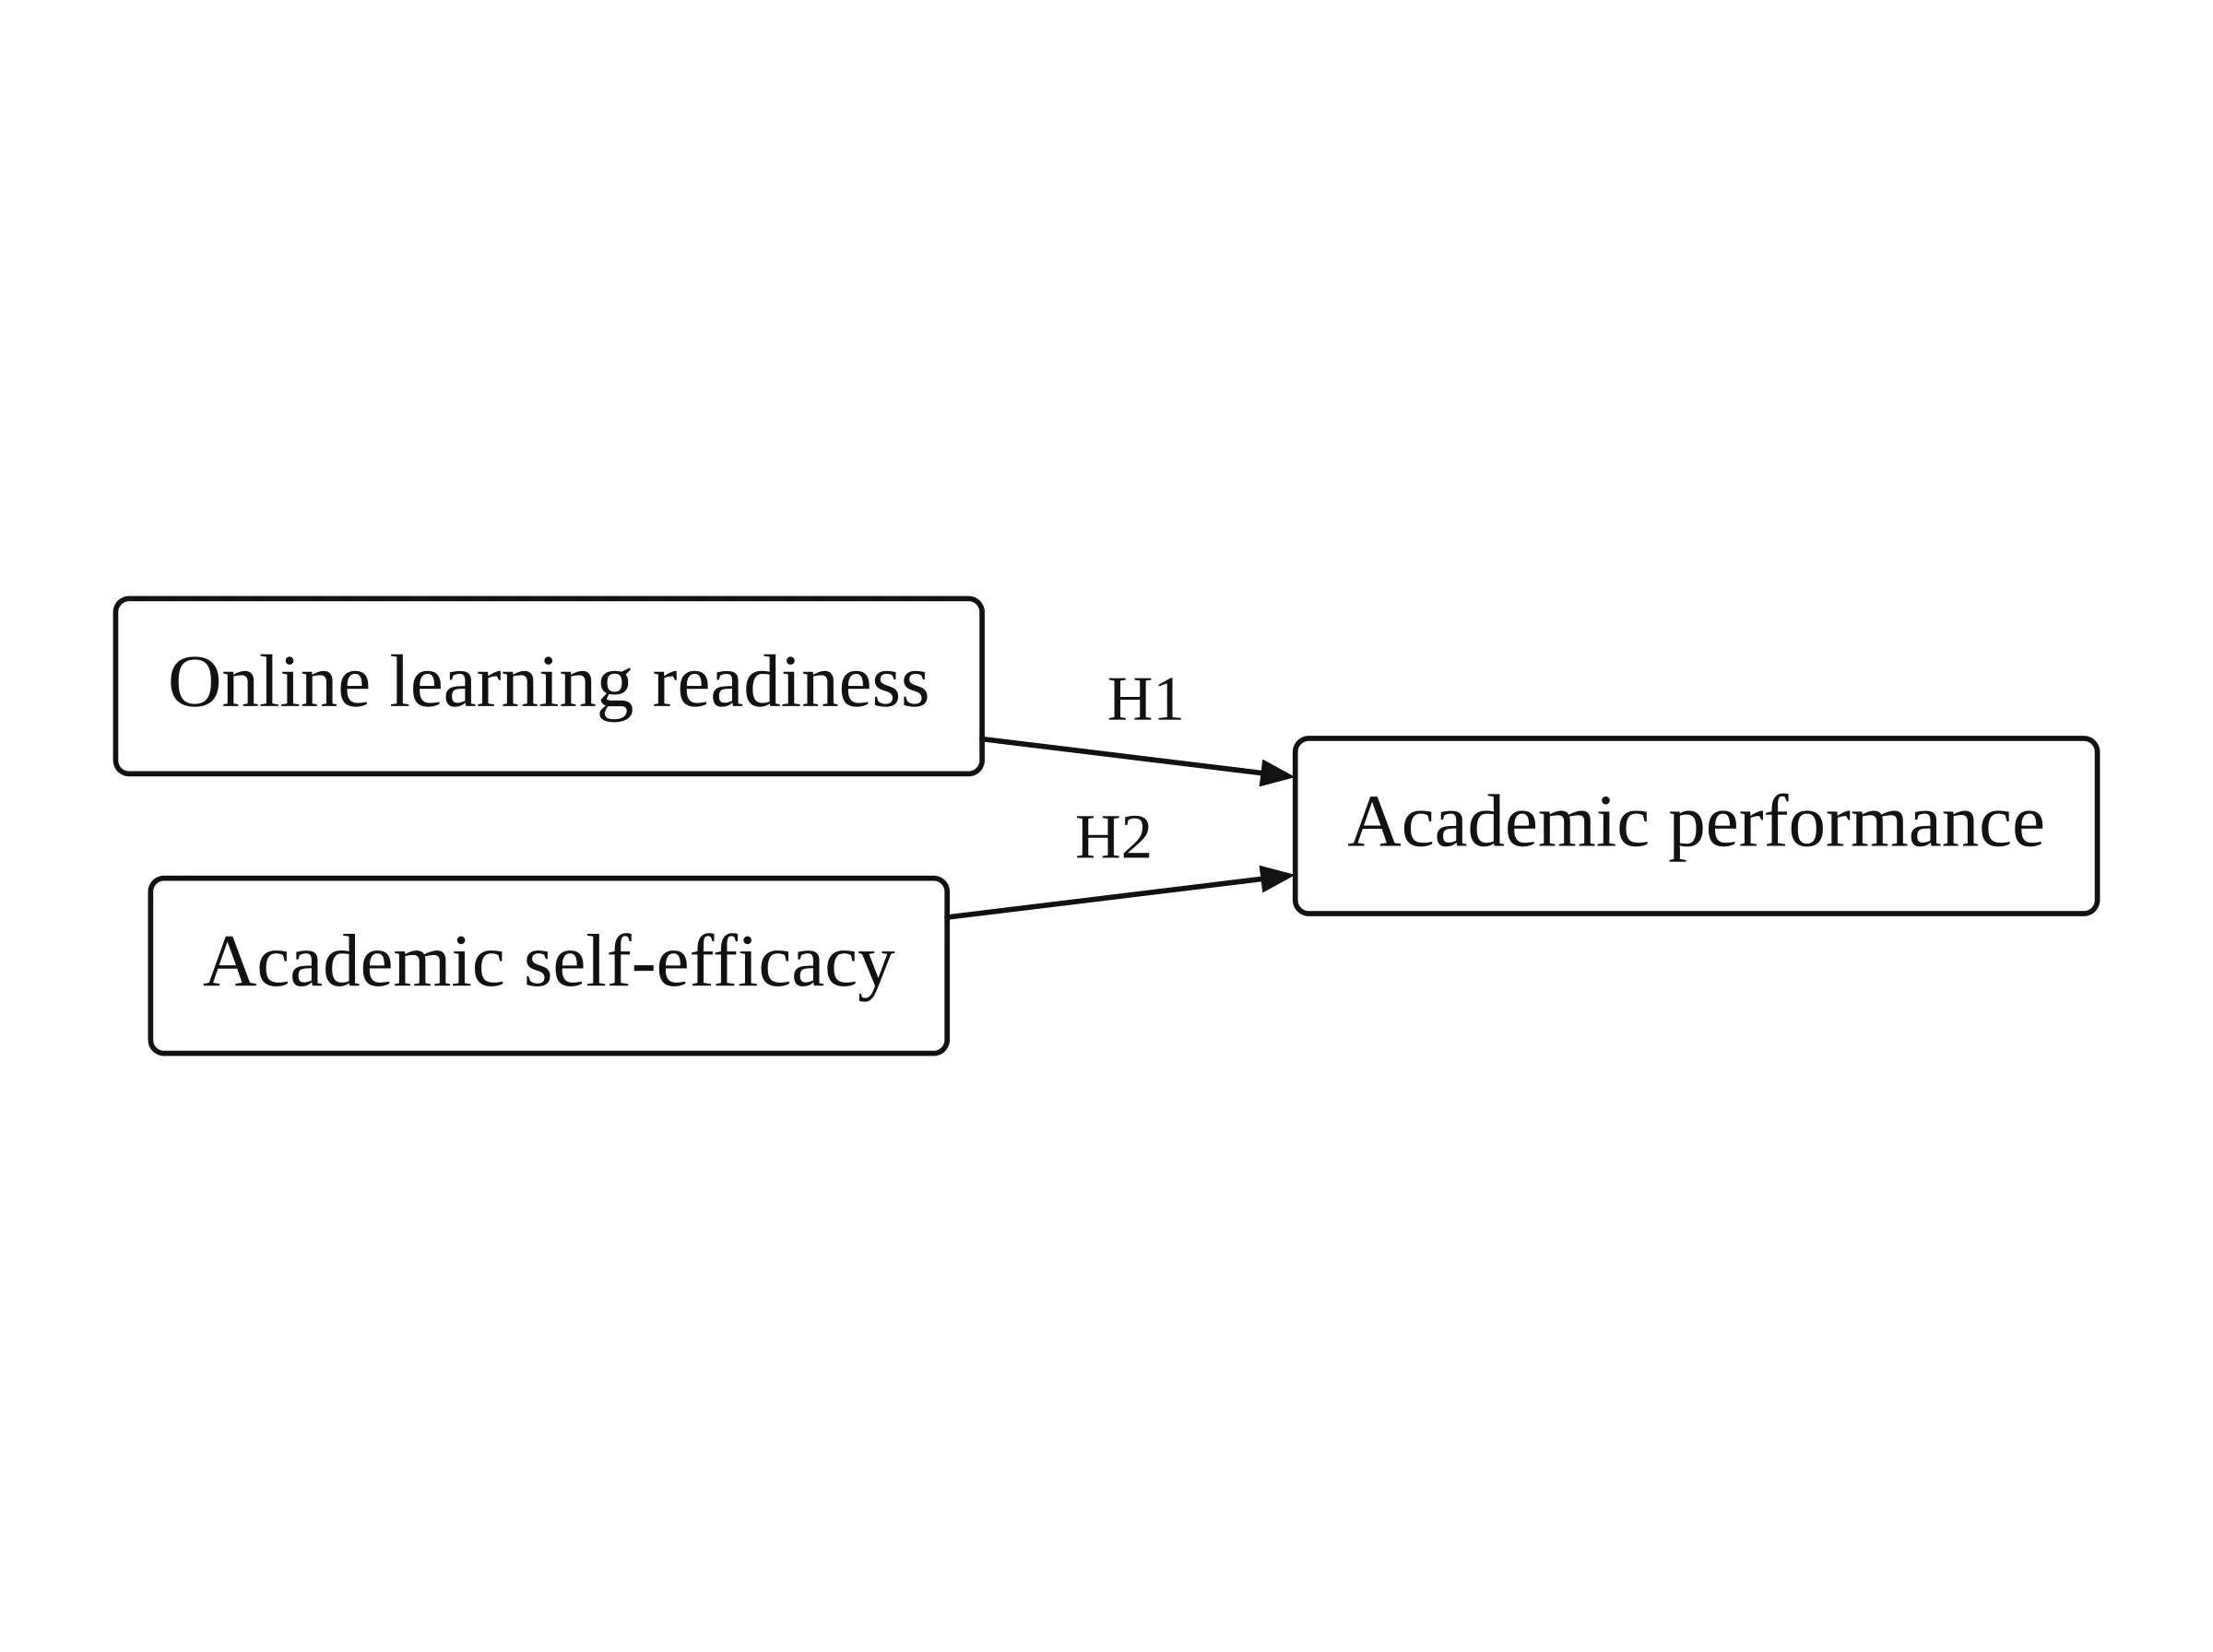
A typical supervisor comment: "Your Chapter 2 argues that readiness works through self-efficacy — that's a mediator, not a second predictor. And you control for prior GPA in the analysis, so show it."
What changed in the description: self-efficacy became the mediator (readiness → self-efficacy as H2, self-efficacy → performance as H3), the direct path stayed as H1, and one sentence was added: "Prior GPA is a control variable on academic performance."
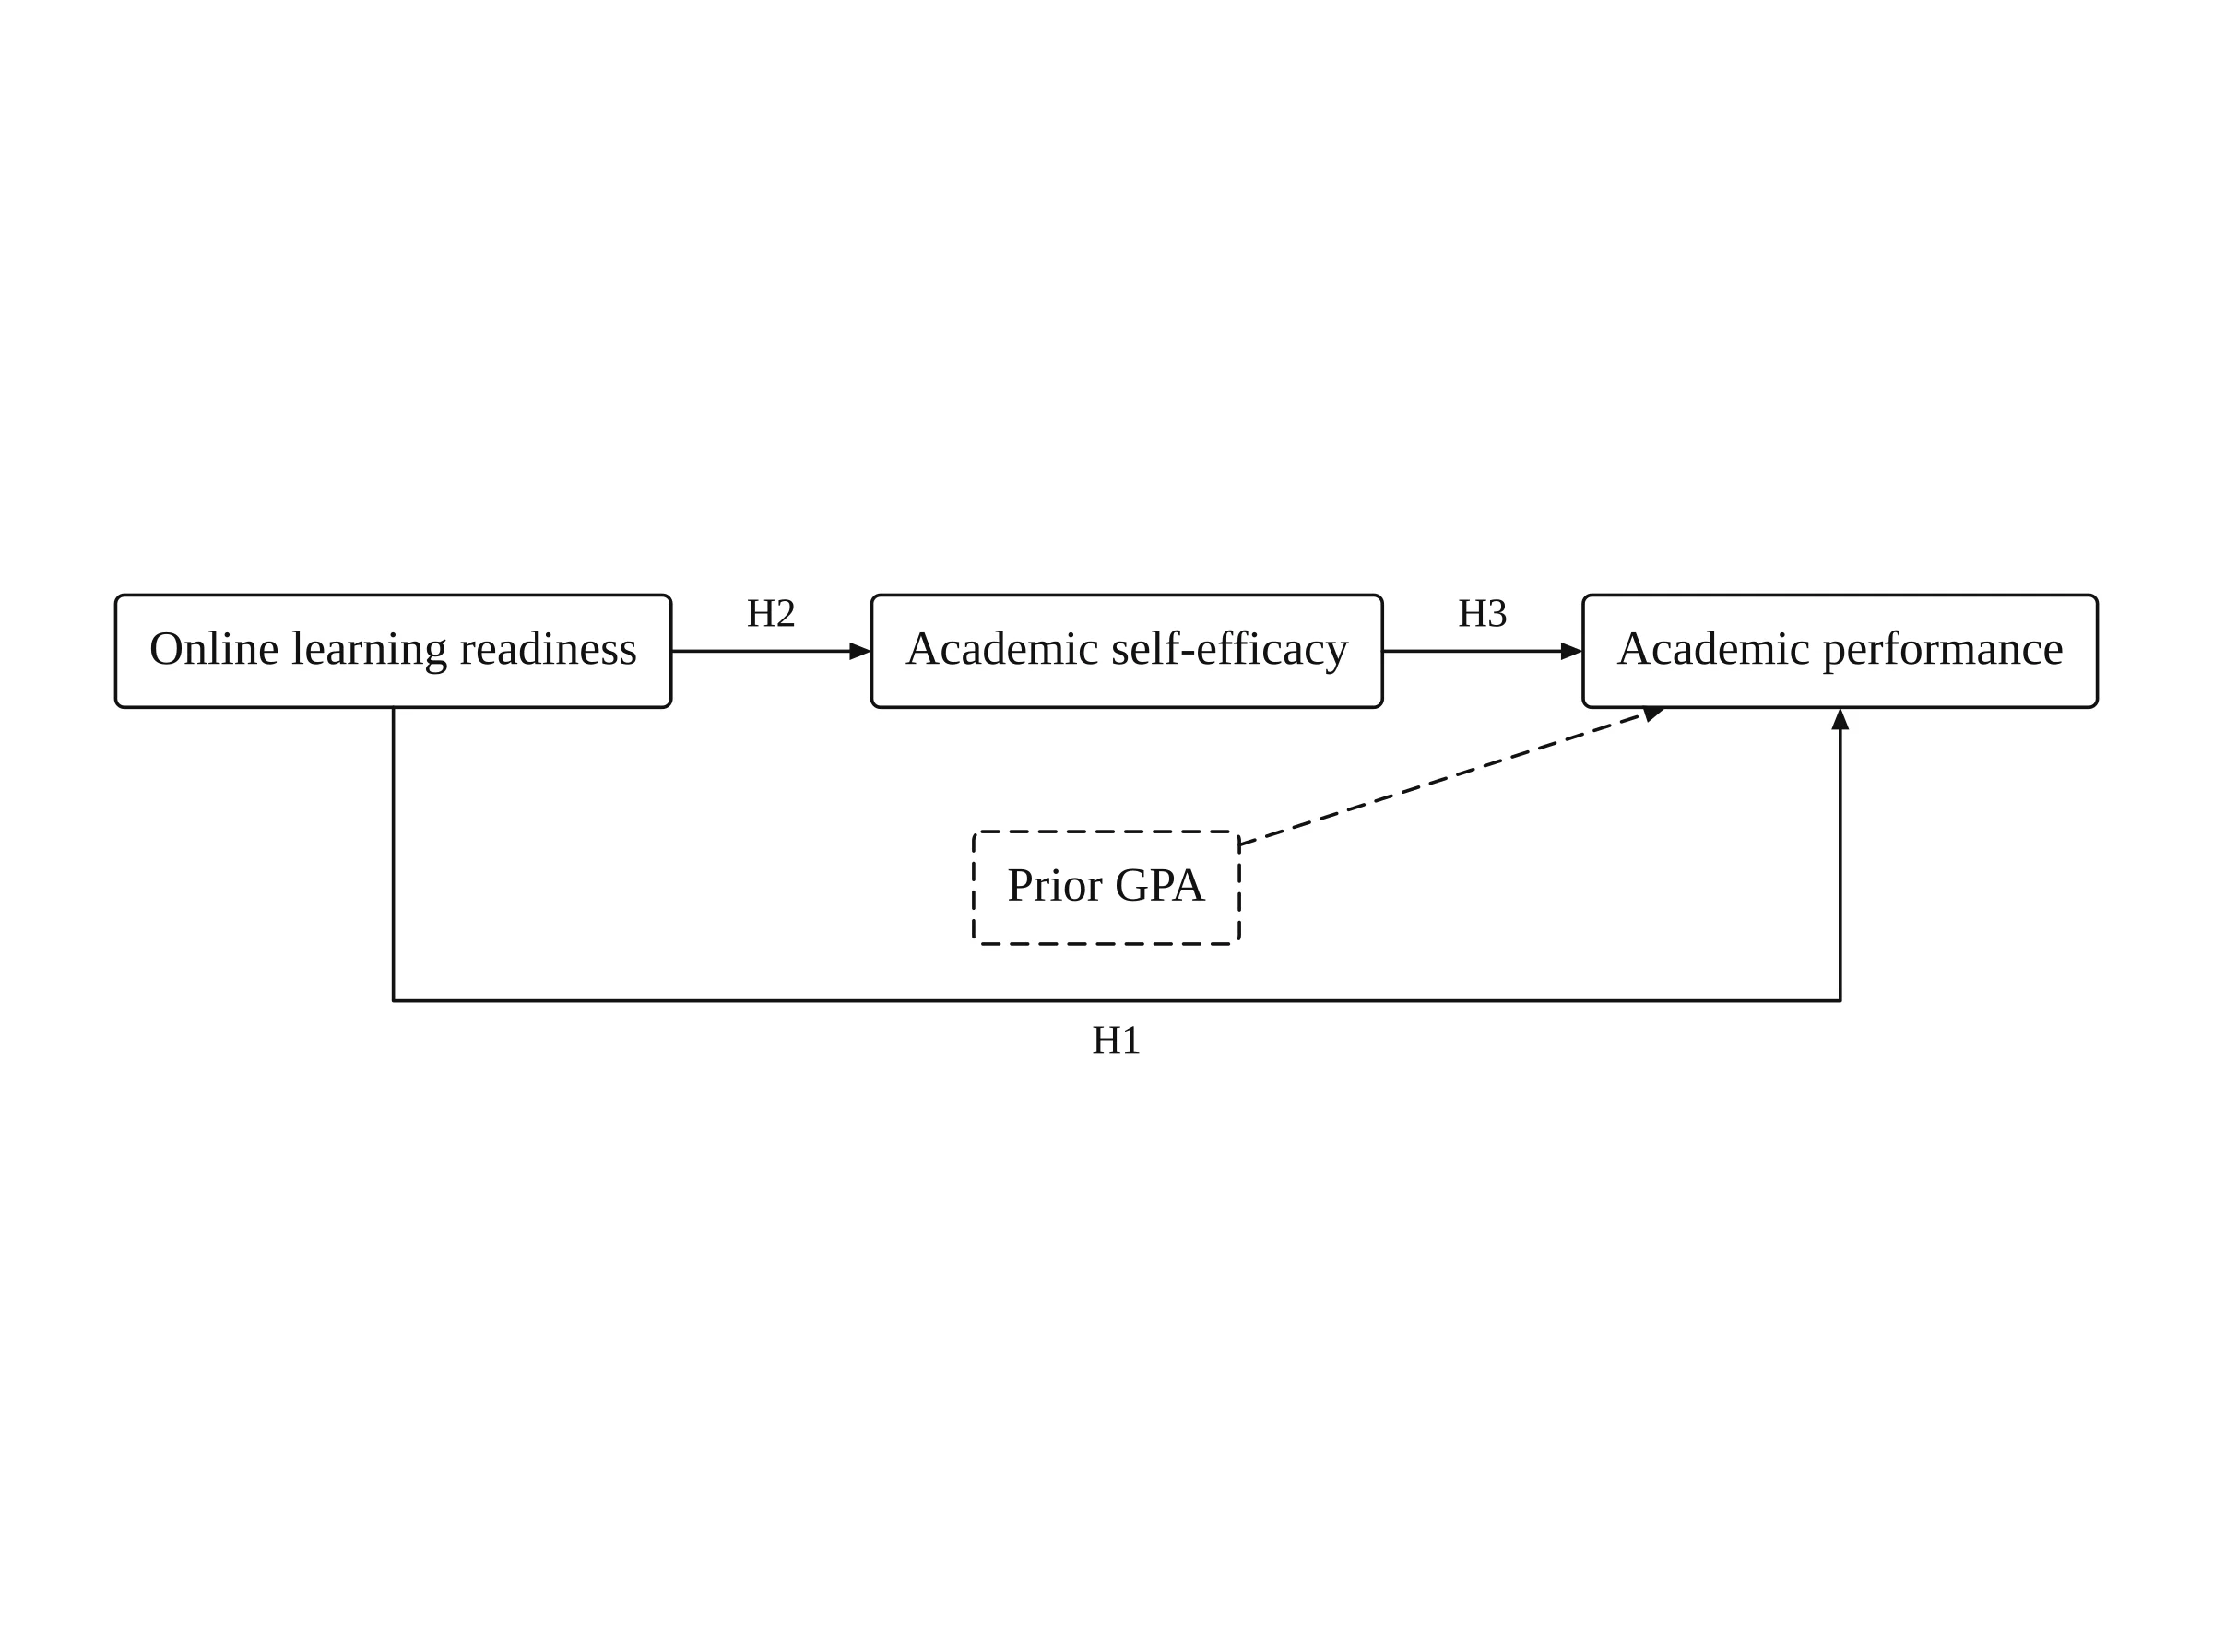
Note what did not happen: you didn't redraw boxes or re-route arrows. You changed two sentences and regenerated, and because the figure is typeset by code, the construct names stayed exactly as written. Each regeneration of a framework uses 2 credits; each version is saved (A1, A2, …) so you can go back while your plan keeps history. Marking the figure in the Studio instead is faster for layout comments, but the image model then redraws the whole picture, so check every label again. For other kinds of comments, revising a framework figure from supervisor comments goes through what each one actually asks you to change.
How do you put the figure into your thesis?
- Word or Google Docs: download the PNG (2K, or 4K on paid plans), or insert the SVG so it stays sharp when printed — inserting an SVG into Word covers the steps.
- LaTeX: include the SVG or PNG; for syntax trees, paid plans can also copy LaTeX
forestcode. - Caption and disclosure: many journals and graduate schools ask you to disclose that an AI tool helped make a figure. Check your graduate school's rules, and use the disclosure line on the journal AI figure policy page if you later publish the chapter.
- Ownership: you own the figures you make, on every plan, including for a thesis, journal article or poster (publication rights).
What does Vizcept cost over a thesis?
Watermark-free downloads, 4K and SVG are paid, because running the models costs money. A code-typeset figure (frameworks, CONSORT, syntax trees) uses 2 credits per generation when you are signed in; an image-model figure uses 5 credits at 2K or 8 at 4K.
| What you need | Option | Price |
|---|---|---|
| One framework figure taken through 13–24 versions (the range two paying thesis writers on Vizcept actually went through), plus a few other figures | Standard Pack, 150 credits (about 75 framework generations) | $19.90 once, valid 365 days, never renews |
| Several chapters' worth of figures over a year | 450-credit pack | $39.90 once, valid 365 days |
| Heavy use during a busy semester | BASIC plan, 300 credits a month | $14.90 a month; cancel any time |
The arithmetic for that first row: 24 versions × 2 credits = 48 credits, which leaves 102 credits in a Standard Pack — about 20 image-model figures at 2K for the rest of the thesis.
Before you pay, you can try it without an account: signing up gives 5 credits and daily check-ins add more; free downloads are watermarked 2K PNGs and free credits expire after 30 days. Verified students get 40% off subscriptions for 12 months (education discount). Credit packs suit a thesis well: when you submit, nothing renews.
What doesn't Vizcept do for a thesis?
- No data plots or experimental images. It does not make charts from your results, western blots, micrographs or scans — publishers forbid AI-generated images of experimental data, and so do our terms.
- It doesn't check your theory. The code places what the model read; if the model misreads which variable moderates which path, the figure is wrong. You (and your supervisor) check the logic.
- Some figures go to the image model. PRISMA diagrams, schematics, uploaded sketches, and figures with Chinese, Japanese or Korean text are drawn by the image model, so labels and numbers can be wrong. Proofread them.
- No team or department accounts. Plans and packs are for one person.
Questions from PhD students
Can I use an AI-generated figure in my thesis?
Usually yes, if you disclose it and the content is your own analysis. Rules differ between universities and journals, so check your graduate school's policy. You own the figures you make with Vizcept on every plan.
Is Vizcept free for students?
Partly. Watermark-free files, 4K and SVG are paid, because running the models costs money. Credit packs start at $19.90 and never renew; plans start at $14.90 a month, and verified students get 40% off subscriptions for 12 months. Your first figure is free without an account, sign-up gives 5 credits, and free downloads are watermarked 2K PNGs; free credits expire after 30 days.
Will I keep getting charged after I finish my thesis?
Not with a credit pack: it is a one-time payment, valid 365 days, and it never renews. Monthly and yearly plans renew until you cancel them in account settings; you keep access until the end of the paid period.
Will my unpublished hypotheses be used to train AI?
No. Vizcept does not train models on what you type or the figures you make, and you own every figure. Requests are processed by our model providers under their own terms.
Can Vizcept draw a mediation or moderation model with hypotheses?
Yes. Describe your independent, dependent, mediating, moderating and control variables with your hypotheses, and the conceptual framework generator labels each hypothesis on its arrow, with moderators pointing at the path they change.
Can I edit the figure in Word, PowerPoint or Illustrator?
On paid plans, download the SVG. For code-typeset figures such as frameworks and CONSORT diagrams, the SVG keeps the text editable; for image-model figures it is traced from the picture.
I'm a linguistics PhD student. Does Vizcept draw syntax trees?
Yes. The syntax tree generator draws traditional phrase structure, X-bar and minimalist trees with traces and movement arrows, and paid plans can copy LaTeX forest code. Right-to-left languages are not laid out right to left yet.
Draw the figure from your Chapter 2
Paste your variables and hypotheses and check the draft. Credit packs start at $19.90 and never renew.
