
Who is this for?
This page is for researchers preparing a manuscript, a conference poster or a grant application, who need a few figures a month rather than a design department:
- a clinical researcher or medical writer who needs a CONSORT participant flow diagram that matches the numbers in the results section;
- a team writing a systematic review or meta-analysis that needs a PRISMA 2020 flow diagram from the screening log;
- a postdoc who wants a quick violin or box plot of one measurement for a lab meeting or a reviewer response, with an editable SVG;
- anyone whose methods section would be easier to follow as a flowchart: an RNA-seq pipeline, a cohort with exclusion steps, a mixed-methods design.
What these jobs share: the content is already decided (the counts, the steps, the data), and the slow part is drawing boxes, aligning arrows and fixing labels by hand.
It is not the right tool if you need images of experimental results (western blots, micrographs, gels, patient images), statistical figures such as forest plots, Kaplan–Meier curves or volcano plots, or a detailed anatomical or cellular illustration from an icon library. See what it doesn't do.
How do you make figures for a research paper with Vizcept?
Two rules apply to every figure in a paper: each figure makes one point, and you draw it at the size it will be printed (one or two journal columns), so text stays readable. Ten Simple Rules for Better Figures covers the design side. For the drawing itself, pick the tool by figure type. Vizcept draws each kind in a different way, and that decides how much you have to check:
| Figure | Where it goes in the paper | How Vizcept draws it | Start here |
|---|---|---|---|
| PRISMA 2020 flow diagram | Methods or results of a systematic review | Typeset by code from your screening counts | PRISMA flow diagram generator |
| CONSORT participant flow diagram (2025 template, or 2010 wording) | Results of a randomised trial | Typeset by code from your enrolment and follow-up counts | CONSORT flow diagram generator |
| Violin, box or scatter plot | Results, supplements, reviewer responses | Drawn in your browser from pasted columns; no AI model involved | Violin plot maker, box plot maker, scatter plot maker |
| Methods or study-design flowchart | Methods; grant research strategy | Drawn by the image model; proofread every box | Research flowchart maker |
| Hypothesis or path model (mediators, moderators) | Introduction or methods in social and health sciences | Typeset by code | Conceptual framework generator |
| Signaling pathway or mechanism schematic | Introduction, discussion, review articles | Drawn by the image model; check every protein and arrow | Signaling pathway diagram maker |
| Graphical abstract draft | Submission, if the journal asks for one | Drawn by the image model; check the journal's AI policy first | Graphical abstract maker |
| Colour palette for all the figures | Every figure | Colorblind-safe palettes such as Okabe–Ito and Paul Tol | Scientific color palette generator |
"Typeset by code" means a language model reads your description into a structure (which count belongs in which box, which variable points at which), and Vizcept's own layout code places the text, boxes and arrows. The wording and numbers are set from what you wrote rather than painted by an image model. The reading can still be wrong, so the check in the next sections still applies. How accuracy works explains the difference for every figure type.
What do the figures look like?
Four figures from the tools above, each shown exactly as produced, with the input that made it.
PRISMA 2020 flow diagram, typeset by code. What we typed: "PRISMA 2020 flow diagram for a systematic review and meta-analysis. Identification: 3,120 records identified from six databases and 21 from trial registers; 702 duplicate records removed. Screening: 2,439 records screened, 2,102 records excluded; 337 reports sought for retrieval, 14 reports not retrieved; 323 reports assessed for eligibility, 109 excluded with reasons (not a randomised trial n=52, insufficient outcome data n=39, duplicate cohort n=18). Included: 214 studies included in review, of which 47 studies included in the meta-analysis."
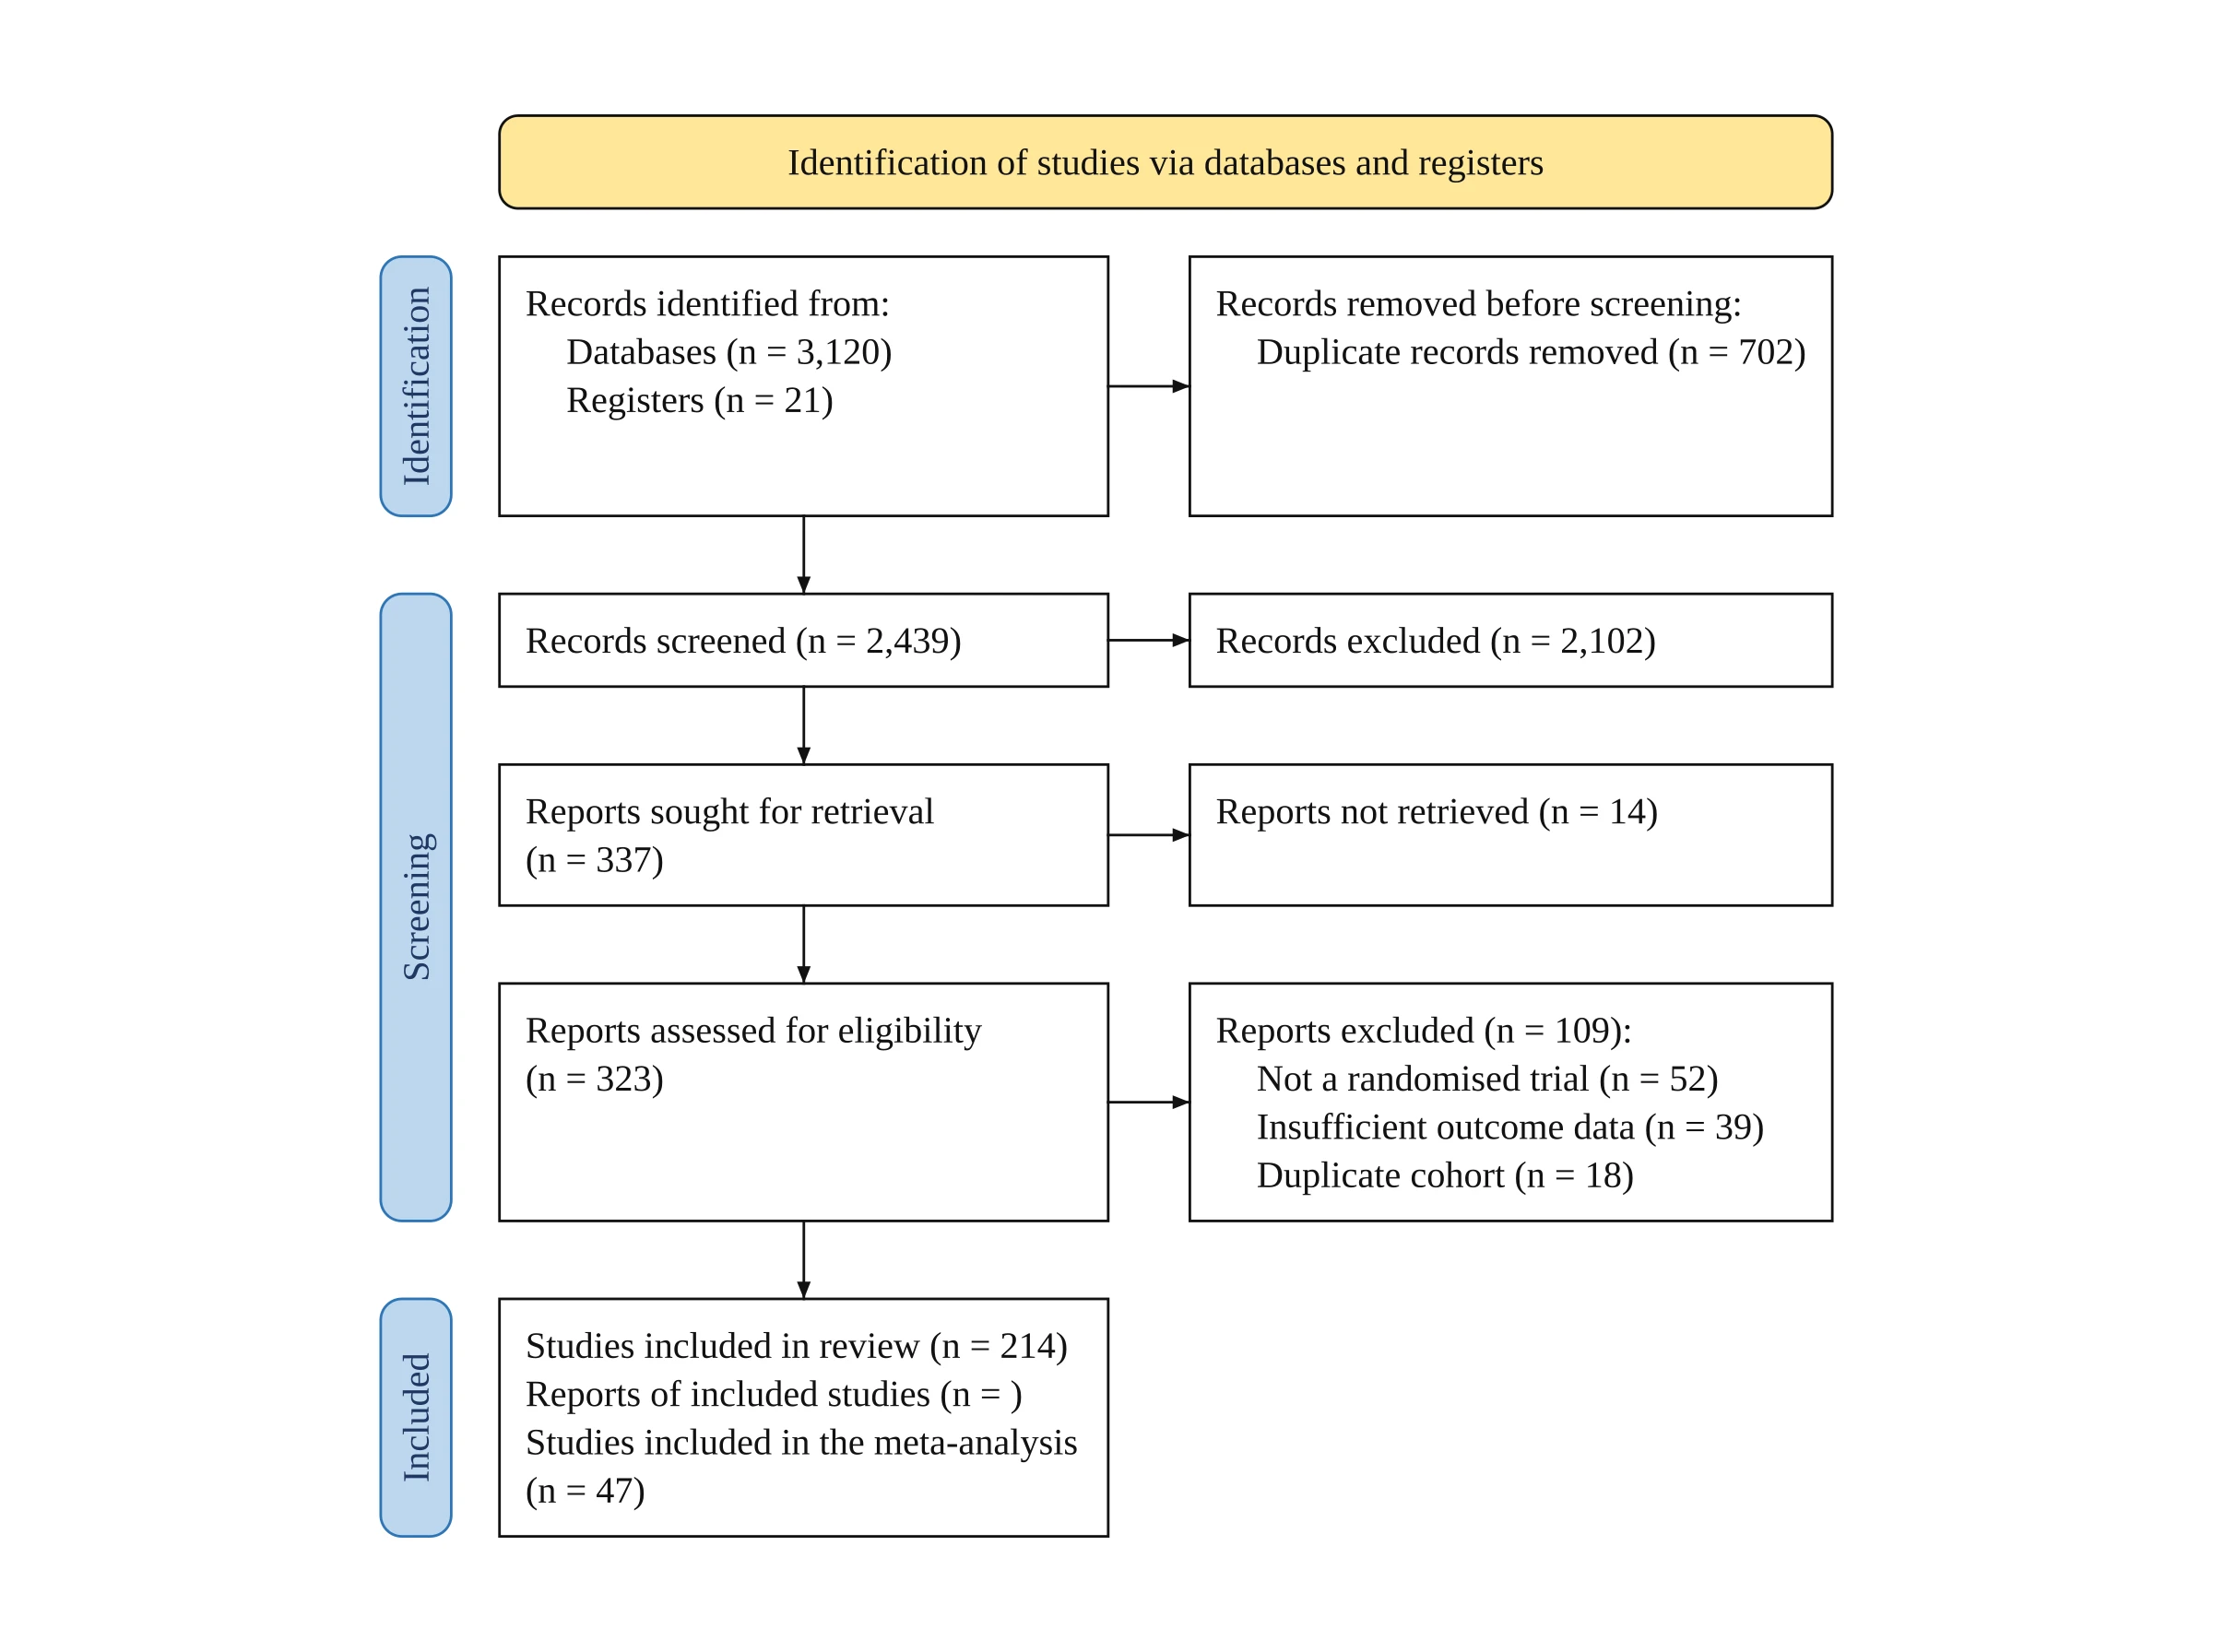
Note the empty "Reports of included studies (n = )": the input never gave that number, so the box is left blank for you to fill in rather than filled with a guess.
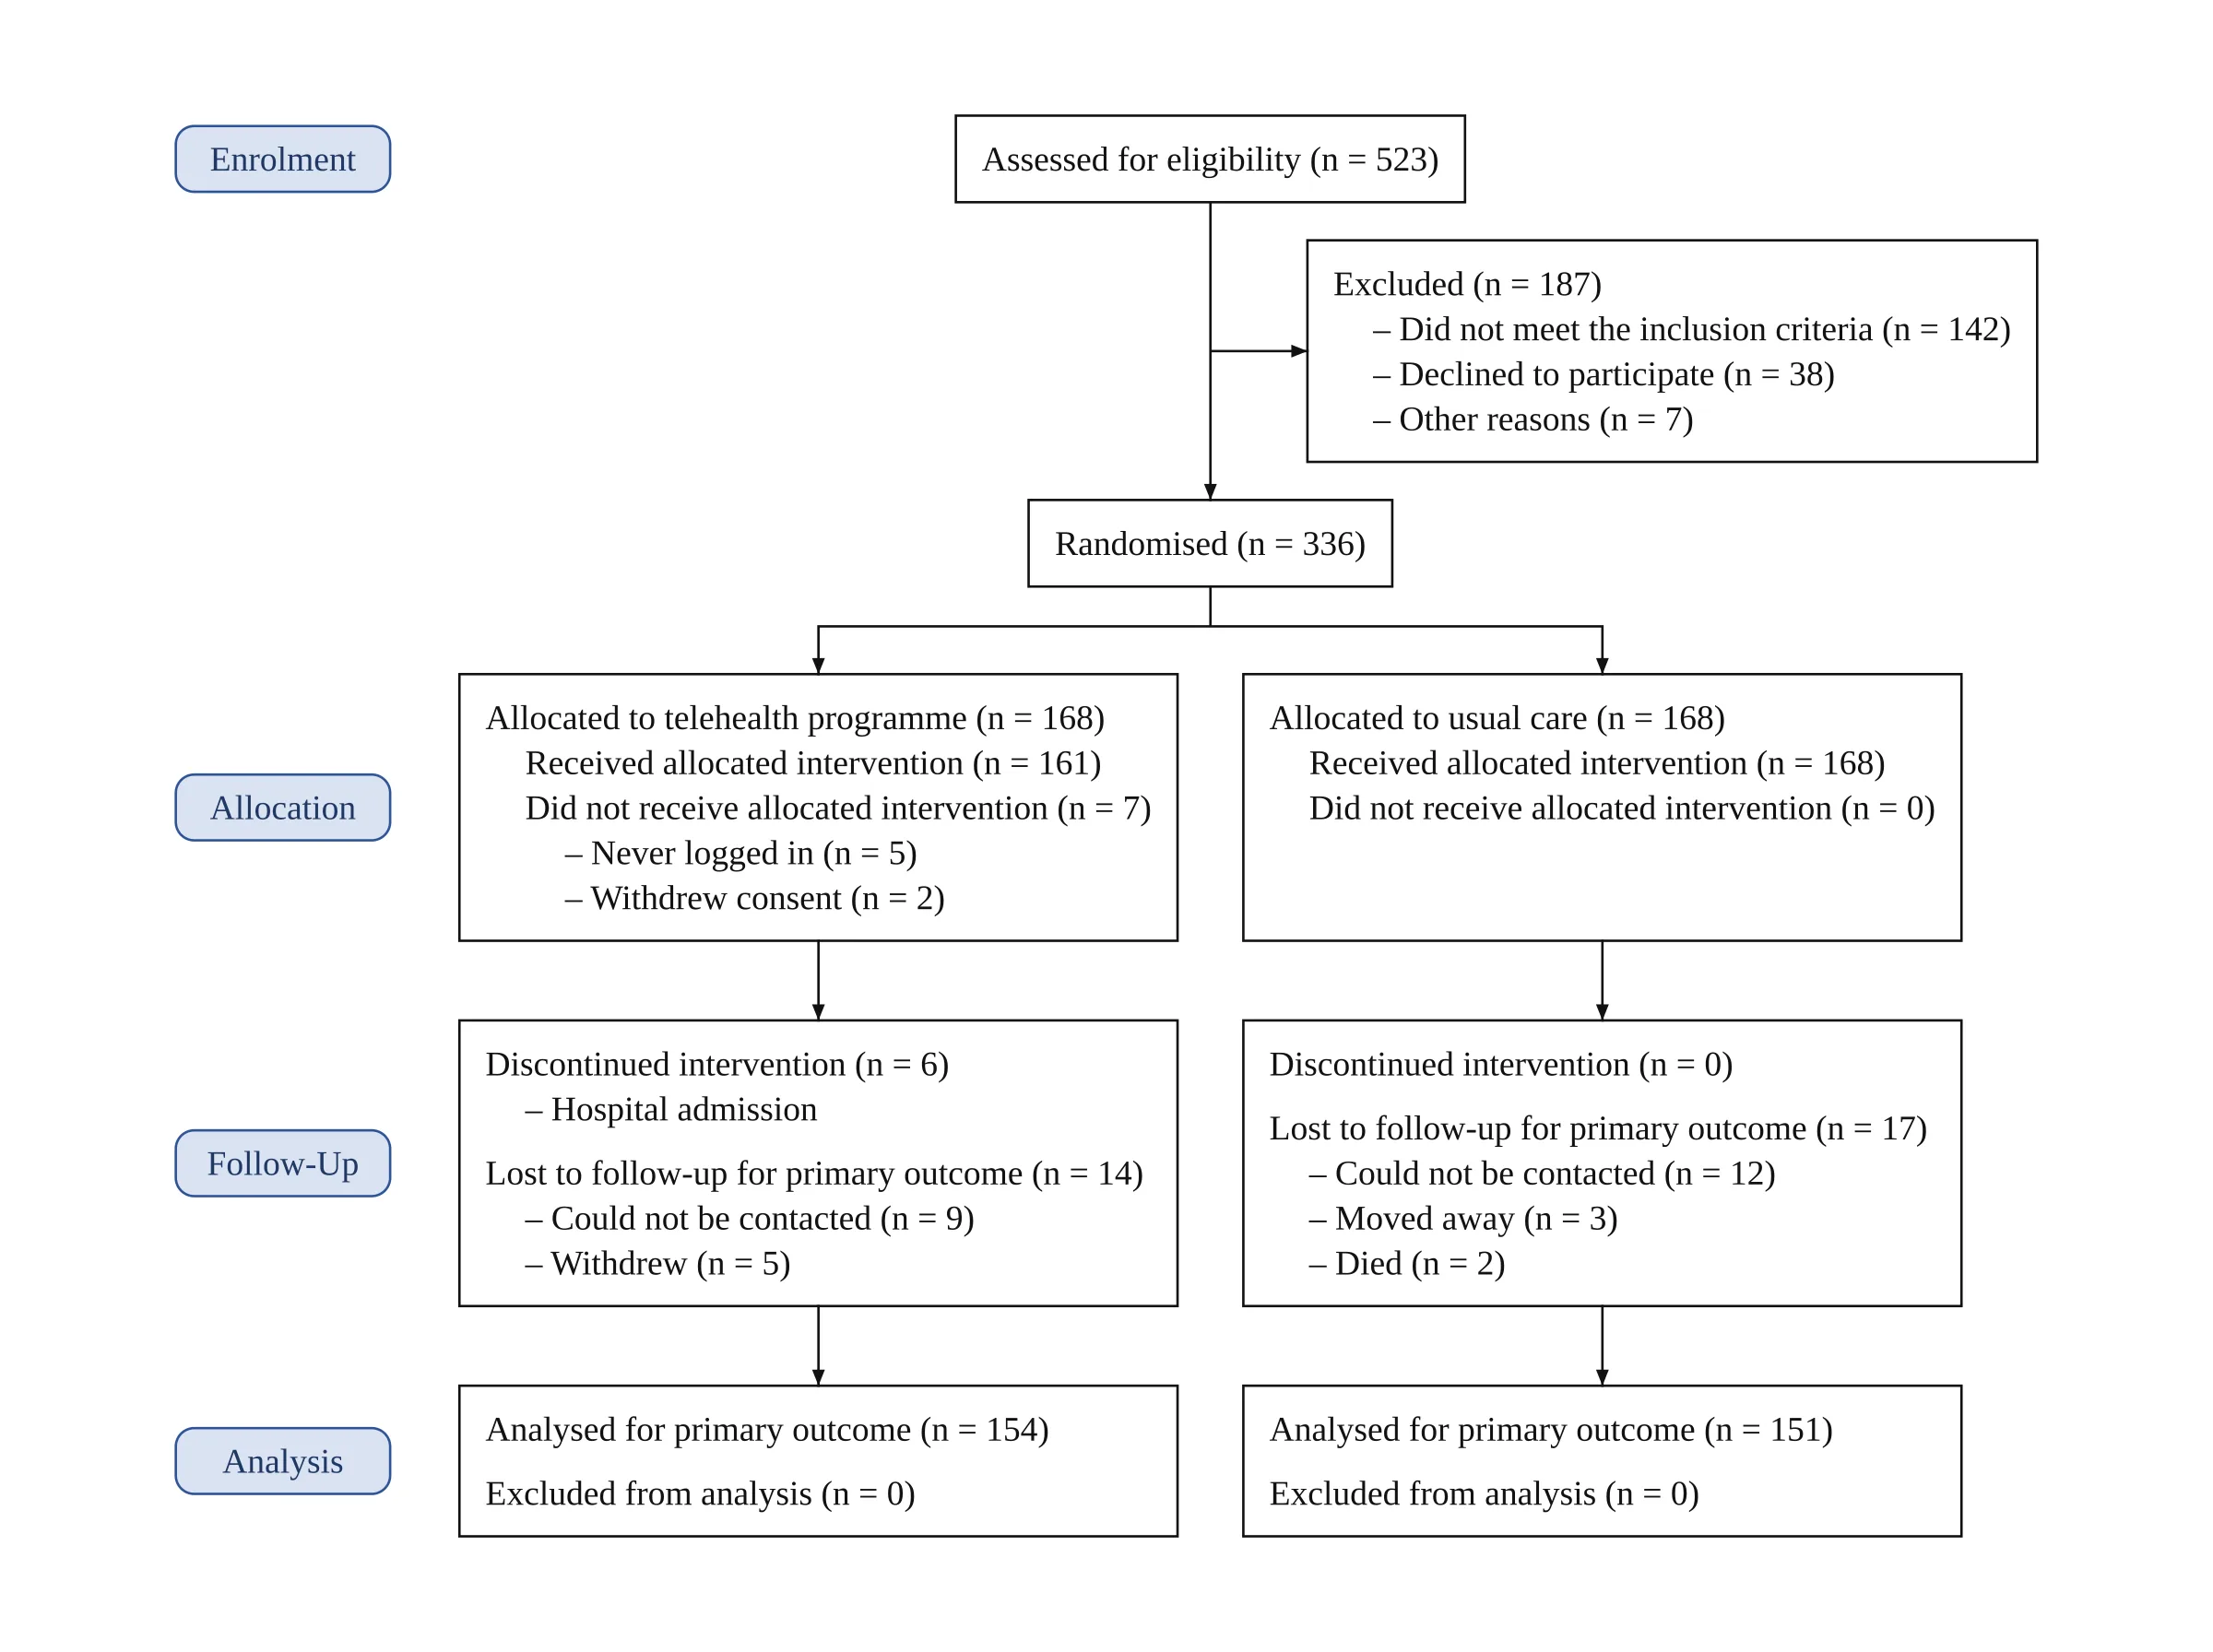
CONSORT flow diagram, typeset by code. The input was one paragraph: 523 assessed for eligibility, 187 excluded with three reasons, 336 randomised to a telehealth programme or usual care, then non-receipt, discontinuation, loss to follow-up and analysis numbers for each arm. It is the two-arm example on the CONSORT generator page, where the full text is shown.
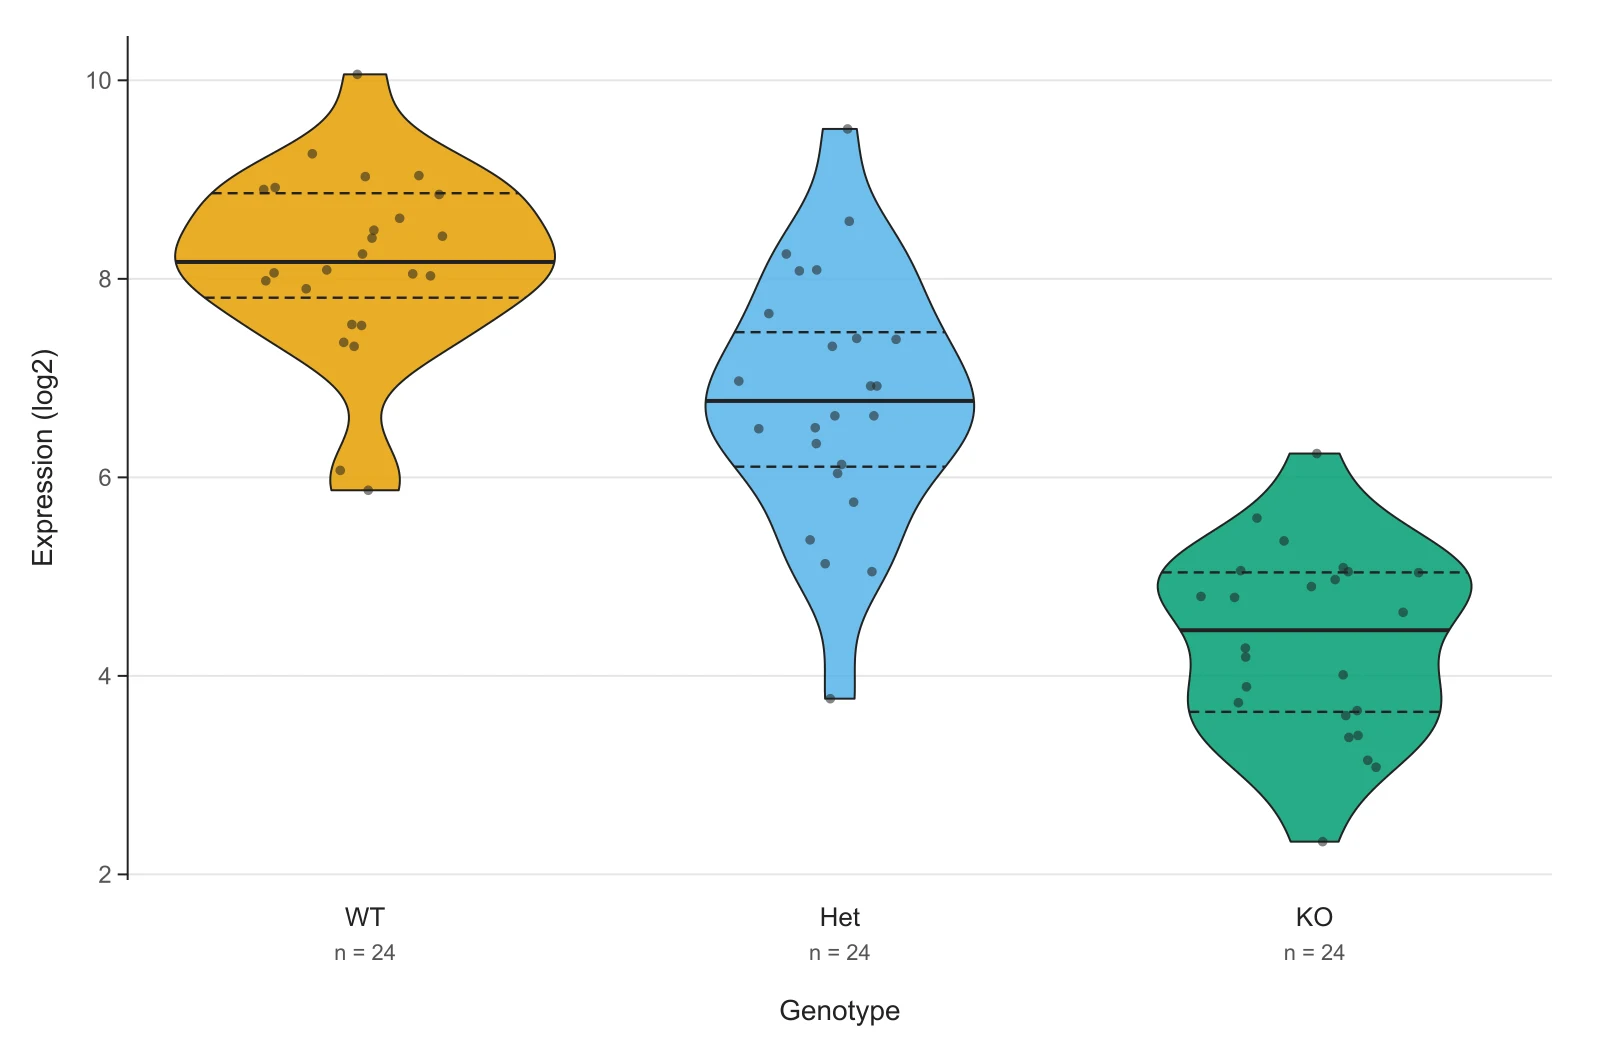
Violin plot, drawn in the browser. Gene expression (log2) for three genotypes, 24 samples each, pasted as two columns (genotype, value). The data are simulated for the example; the plot is the tool's own output. Open this dataset in the violin plot maker to change the settings or paste your own.
Methods flowchart, drawn by the image model. What we typed (shortened): an RNA-seq study from tissue collection in 24 tumour and 24 matched normal samples, through two quality gates ("RIN ≥ 7?" and "Mapping rate ≥ 80%?"), alignment with STAR, DESeq2 and qPCR validation, with a side module noting that software versions are in the supplement. The full text is on the research flowchart maker page.
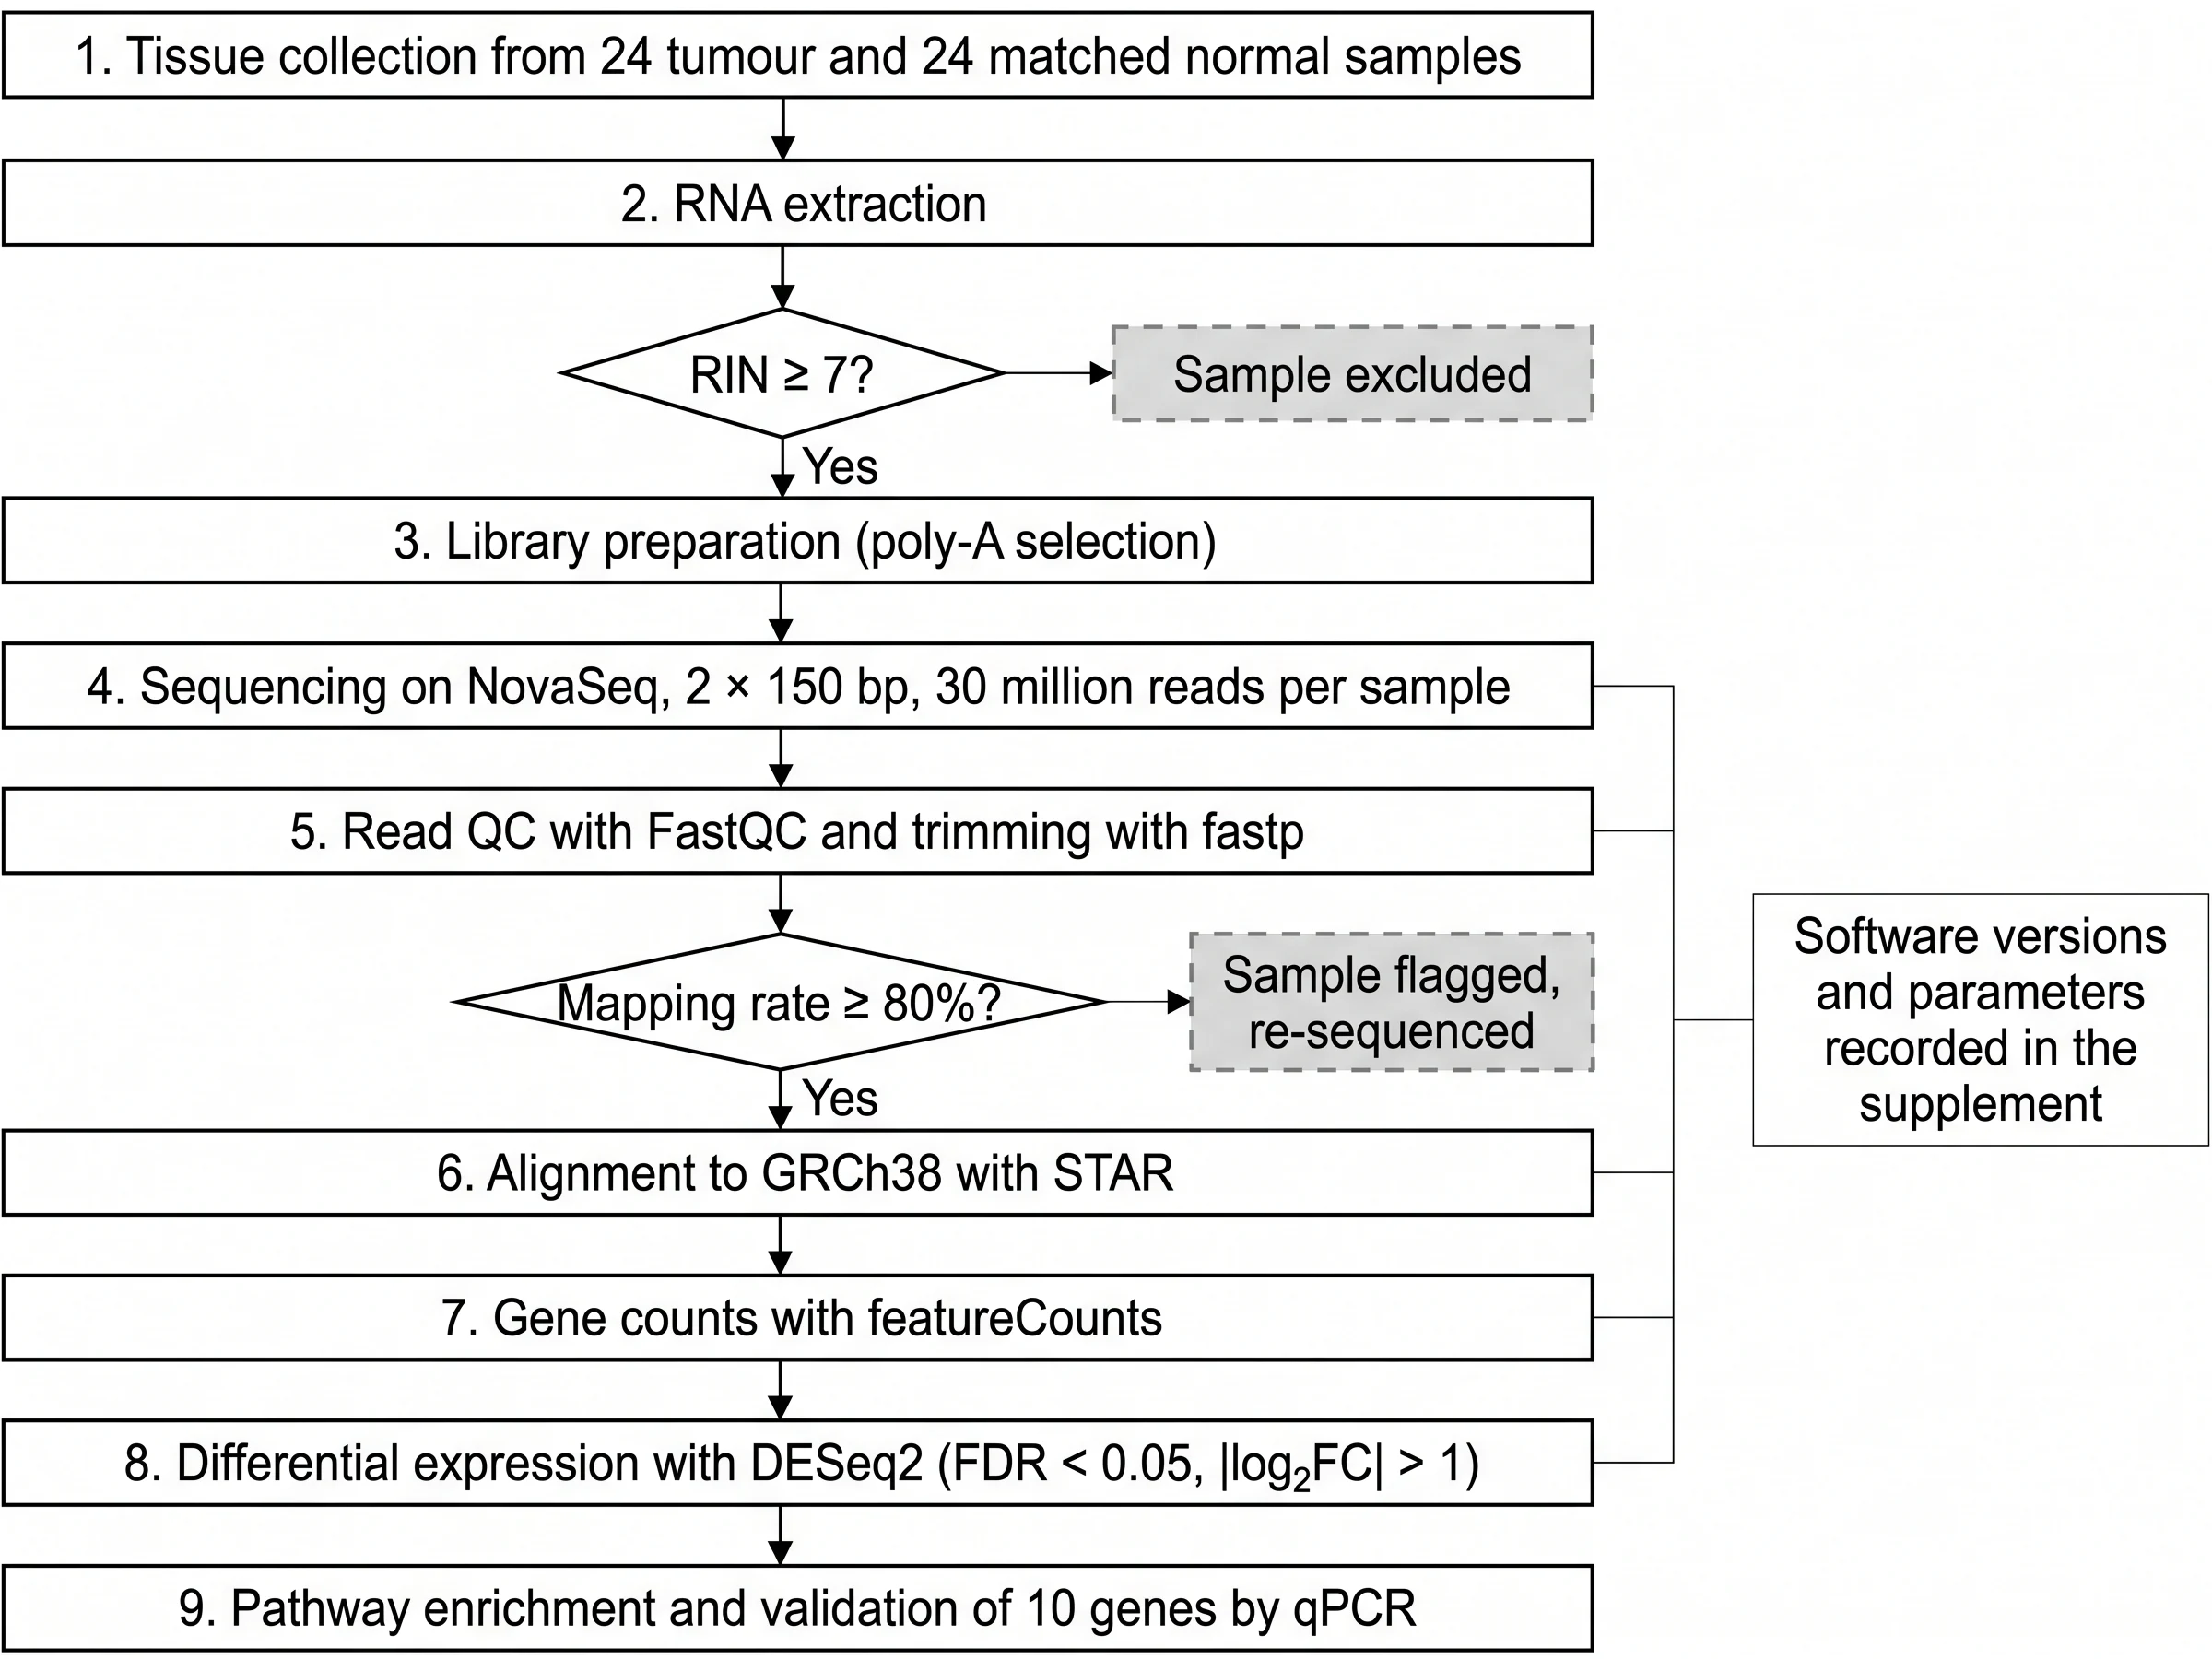
Every label in it is right, but look at the two diamonds: the branches to "Sample excluded" and "Sample flagged, re-sequenced" carry no "No" label, although the "Yes" branches do. That is the kind of slip to look for in an image-model figure before it goes into a manuscript.
What should you check before a figure goes into the manuscript?
Check by how the figure was made:
- Flow diagrams (PRISMA, CONSORT): the counts against your log. Every count greater than zero must appear in the text you wrote. If the model cannot find a count in your text, it removes it and leaves the box as "(n = )". Vizcept does not make your numbers add up. If records screened minus records excluded is not the number of reports sought, the diagram still shows your numbers as written. Do that arithmetic before you generate.
- Flow diagrams: the template. PRISMA uses the 2020 template for new reviews, with an optional "other methods" column. CONSORT uses the 2025 template unless you ask for 2010 wording. Some designs go to the image model instead: updated reviews with a previous-studies column, crossover and cluster trials, and trials with more than five arms. Those need the image-model checks below.
- Image-model figures (flowcharts, pathways, graphical abstracts): every label, arrow and branch. Image models occasionally drop a word, merge two boxes, reverse an arrow or invent a protein. Compare each box with your text, and for a pathway, each interaction with your sources.
- Data plots: the method behind each line. Box plots let you pick the quartile method (TI-84 or textbook, Tukey hinges, Excel INC as in R and Python, Excel EXC as in Minitab); the scatter plot fits an ordinary least-squares line and reports r and R², not a p-value. If a number differs from your stats software, the method is the first thing to compare.
- All figures: the caption. A caption that lets the figure stand alone has four parts:
- a first sentence that states the finding or what the diagram shows;
- what each panel, abbreviation and unit means;
- for plots, n per group and what the lines, boxes or error bars represent (median and quartiles, mean and SD);
- where your journal asks, which tool made the figure (see the next section).
Will a journal accept figures made with Vizcept?
It depends on the publisher and on what the figure claims to show. Most publishers sort figures into explanatory figures, data visualizations and images of research results, and set different rules for each. Here is how Vizcept's figures map onto those categories:
| Vizcept figure | Publisher category | What that usually means |
|---|---|---|
| PRISMA and CONSORT diagrams, methods flowcharts, path models | Explanatory figure | Elsevier, Wiley and Taylor & Francis allow AI help with a disclosure; Springer Nature and Science are stricter |
| Violin, box and scatter plots from pasted data | Data visualization | Drawn by code from your data, with no AI model involved, so it is the same kind of figure as one from R or Excel. If you used Describe with AI to read numbers from text, check them and disclose that step |
| Graphical abstract draft | Graphical abstract | Elsevier does not allow general-purpose AI image tools for graphical abstracts; other publishers vary |
| Western blots, micrographs, gels, patient images | Image of research results | Not allowed to generate with AI anywhere. Vizcept does not make them |
The journal AI figure policy page quotes ten publishers' current rules, says where each wants the disclosure (caption, AI declaration, Methods or cover letter) and generates the disclosure text for your publisher. Read your journal's own author instructions as well: individual journals can be stricter than their publisher. Rights in the figures you make are covered on the publication rights page.
Which file formats can you submit?
A PNG is a grid of pixels: enlarge it past its size and it blurs, so check its pixel width against the journal's minimum DPI at the printed width. An SVG is vector: it stays sharp at any size and its text can be edited.
| Format | Which figures | Plan |
|---|---|---|
| PNG at 2K | Every figure type | Free downloads carry a small watermark; clean files are paid |
| PNG at 4K | Flow diagrams, flowcharts, schematics | Paid plans and credit packs |
| PNG at 300 DPI | Violin, box and scatter plots | Free, no watermark |
| SVG with real, editable text | Code-typeset figures (PRISMA, CONSORT, path models) | Paid plans and credit packs |
| SVG with real, editable text | Violin, box and scatter plots | Free |
| SVG traced from the picture | Image-model figures | Paid plans and credit packs; the text is outlines, not editable type |
There is no direct TIFF, EPS or PDF export. If your journal's artwork instructions ask for one of those, open the SVG in Adobe Illustrator or Inkscape and export it from there, at the resolution and width the journal specifies; the same SVG goes into Word or PowerPoint for a draft or a poster (how to insert an SVG into Word). Check the journal's minimum resolution against the PNG options above before you choose a format.
What does a paper's worth of figures cost?
The data plots are free: paste, adjust and download the PNG or SVG without a watermark or credits. Only Describe with AI, which turns numbers in a paragraph into a dataset, uses 2 credits.
For everything else, watermark-free files, 4K and SVG are paid, because running the models costs money. Signed in, a code-typeset figure (PRISMA, CONSORT, path model) uses 2 credits per version; an image-model figure (flowchart, pathway, graphical abstract) uses 5 credits at 2K or 8 at 4K.
A systematic review manuscript with a PRISMA diagram redrawn four times as the screening log changes, plus a methods flowchart generated three times at 2K, is 8 + 15 = 23 credits:
| What you need | Option | Price |
|---|---|---|
| One or two papers a year | Standard Pack, 150 credits | $19.90 once, valid 365 days, never renews |
| Several papers, a poster and a grant | 450-credit pack | $39.90 once, valid 365 days |
| Figures every month | BASIC plan, 300 credits a month | $14.90 a month, or $106.80 billed yearly; cancel any time |
Before you pay: your first figure is free, signing up gives free credits and daily check-ins add more, and free downloads are watermarked 2K PNGs. Free credits expire after 30 days. Every paid option includes a commercial use license. If you are comparing with a subscription illustration tool you only open a few times a month, see the BioRender comparison. All plans are on the pricing page.
What doesn't Vizcept do for researchers?
- No images of experimental data. No western blots, micrographs, gels, histology or patient images; publishers ban generating them, and so do Vizcept's terms.
- No statistical figures beyond violin, box and scatter plots. No forest plots, Kaplan–Meier curves, volcano plots, heatmaps or histograms. For a meta-analysis forest plot use RevMan or R's meta or metafor packages; for survival curves, R or Prism.
- No statistics. The scatter plot fits a straight line and reports r and R², with no p-values or significance tests; the box plot does not run comparisons between groups.
- No reading spreadsheets directly. Copy the columns and paste, or save as CSV; .xlsx files are not read.
- No balancing of flow-diagram counts. Numbers are copied from your text, never corrected or filled in (see what to check).
- No icon library or canvas. Schematics are generated from a description, not assembled from drawn icons; you revise by describing the change or by marking up the figure in the workbench, which redraws it with the image model.
- No team seats or institutional invoices. Accounts are individual; a lab can buy credit packs on one account.
- Chinese, Japanese and Korean text goes to the image model, except in PRISMA diagrams, where Chinese is typeset by code.
Questions from researchers
Does Vizcept check that my PRISMA or CONSORT numbers add up?
No. It copies the counts you write into the right boxes and leaves a box empty when your text has no number for it, but it does not correct numbers that don't add up. Reconcile the counts in your screening log or trial records first, then generate.
Can I edit the figure in Illustrator or Inkscape?
Yes, as an SVG. PRISMA, CONSORT and path-model SVGs keep real, editable text and are included in paid plans and credit packs; violin, box and scatter plot SVGs are free. SVGs of image-model figures are traced from the picture, so their text is outlines rather than editable type.
Can Vizcept make a forest plot or a Kaplan–Meier curve?
Not yet. The data-plot tools cover violin, box and scatter plots. For a forest plot use RevMan or R's meta or metafor packages, and for Kaplan–Meier curves use R or GraphPad Prism; Vizcept can draw the PRISMA or CONSORT diagram that goes with them.
Is Vizcept free for researchers?
Partly. The violin, box and scatter plot makers are free to use and download without a watermark. Other figures: your first one is free, sign-up gives free credits, daily check-ins add more, and free downloads are watermarked 2K PNGs. Clean files, 4K and SVG are paid: credit packs from $19.90 that never renew, or plans from $14.90 a month.
Do you train AI on my figures or data?
No. The figures you make are yours, Vizcept does not train models on your descriptions, data or figures, and it does not show your work publicly without your consent. The model providers that draw or analyse a figure process the request under their own terms.
Can my lab share one account?
There are no team seats yet. A lab can buy credit packs on one account and share the downloaded files; credits are valid for 365 days and never renew.
Draw the flow diagram for your next paper
Write your counts as a paragraph and get a PRISMA or CONSORT diagram typeset by code, or paste data for a free violin, box or scatter plot.
