
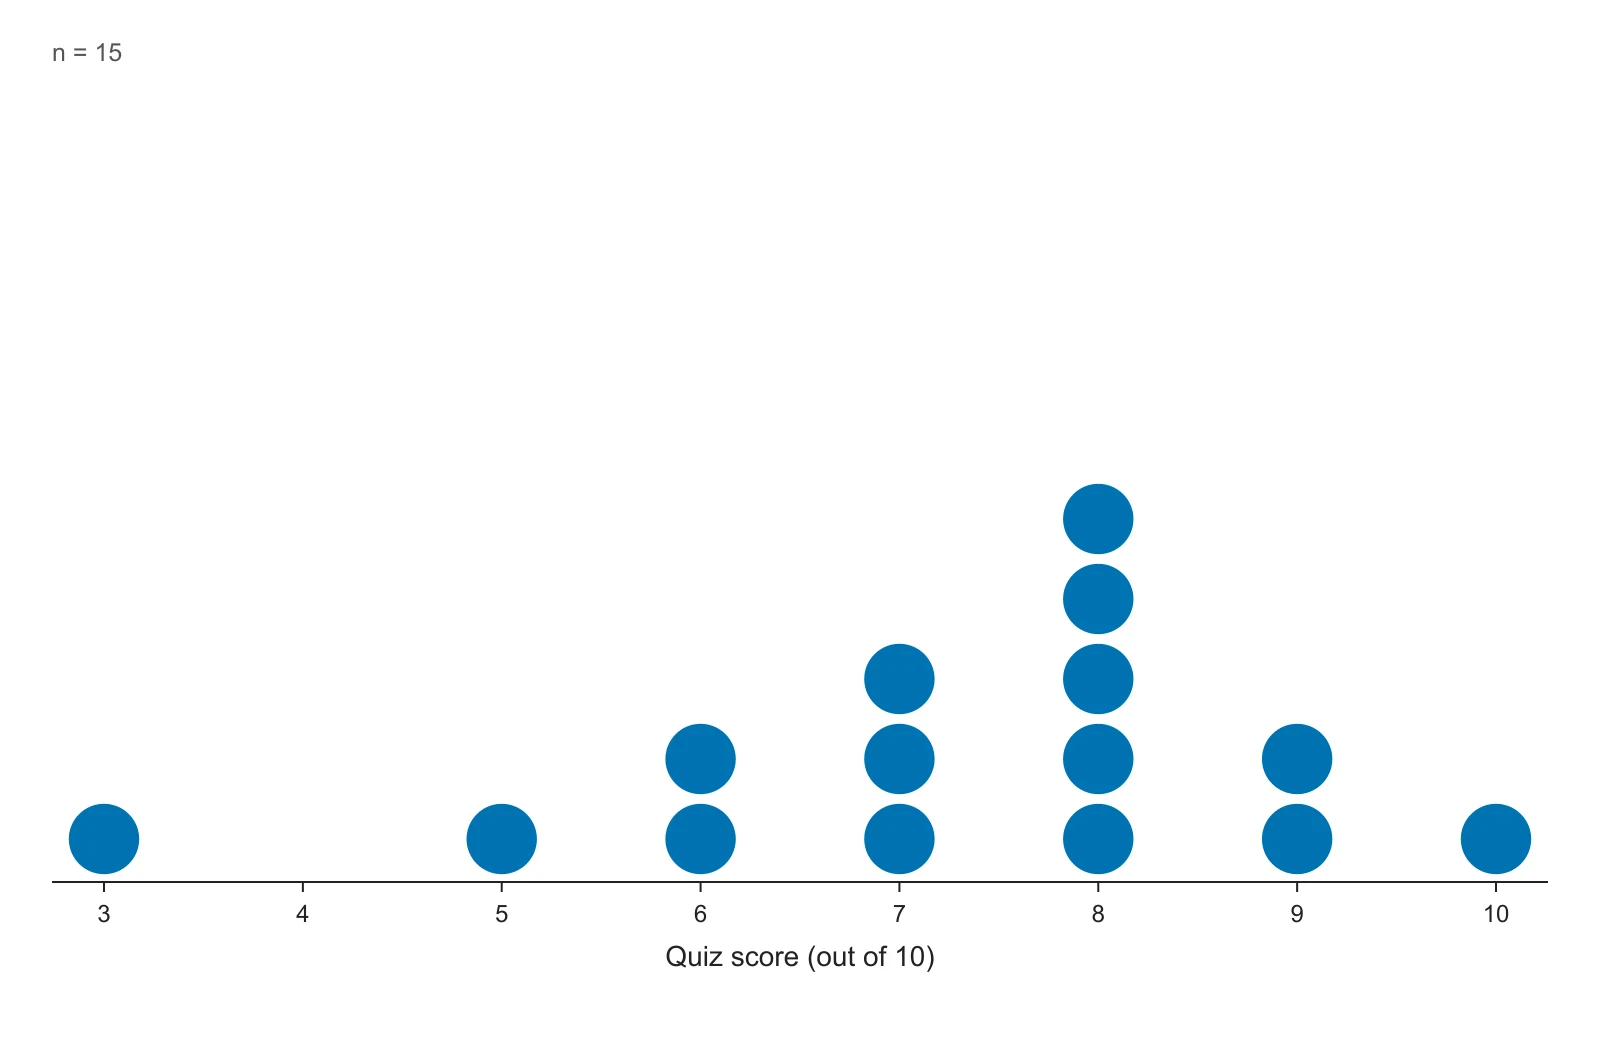
Dot plot of quiz scores
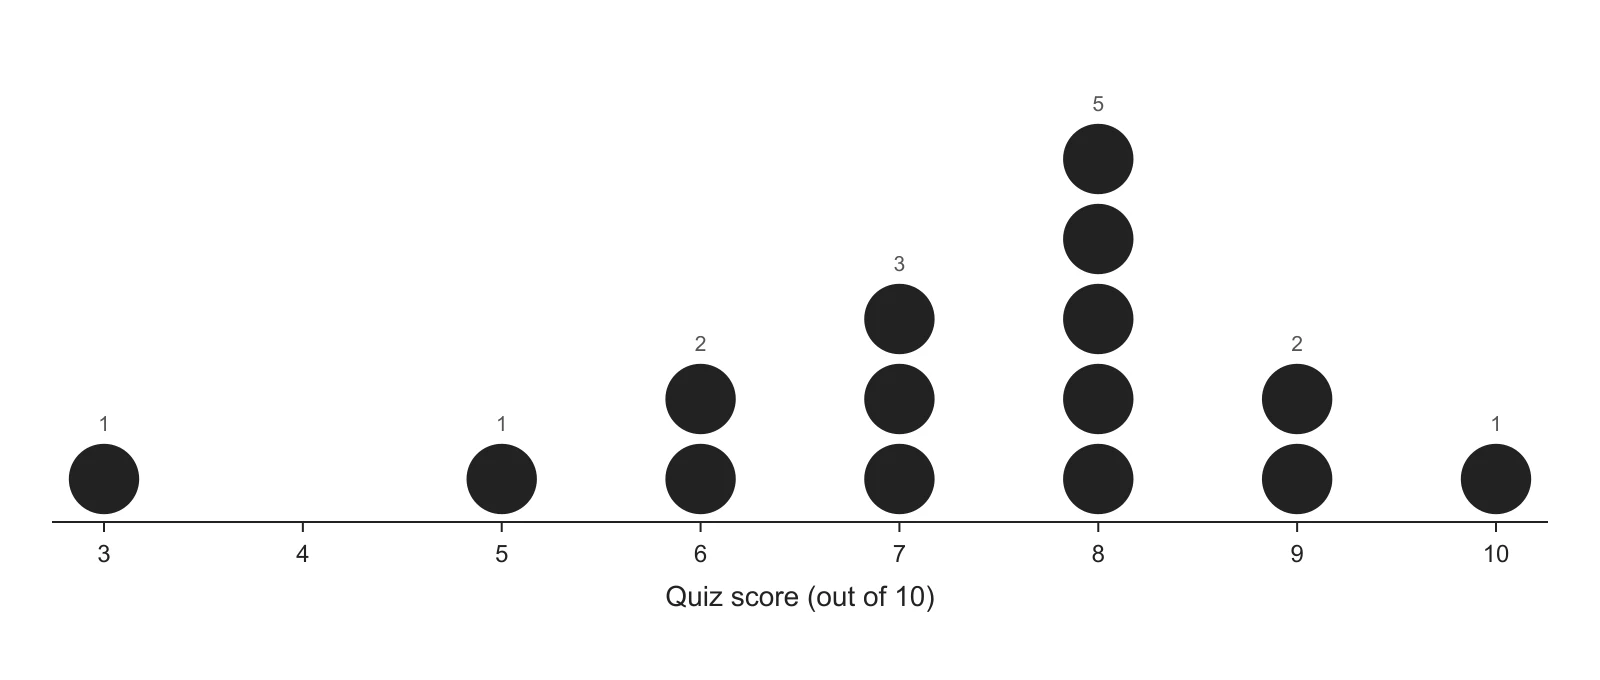
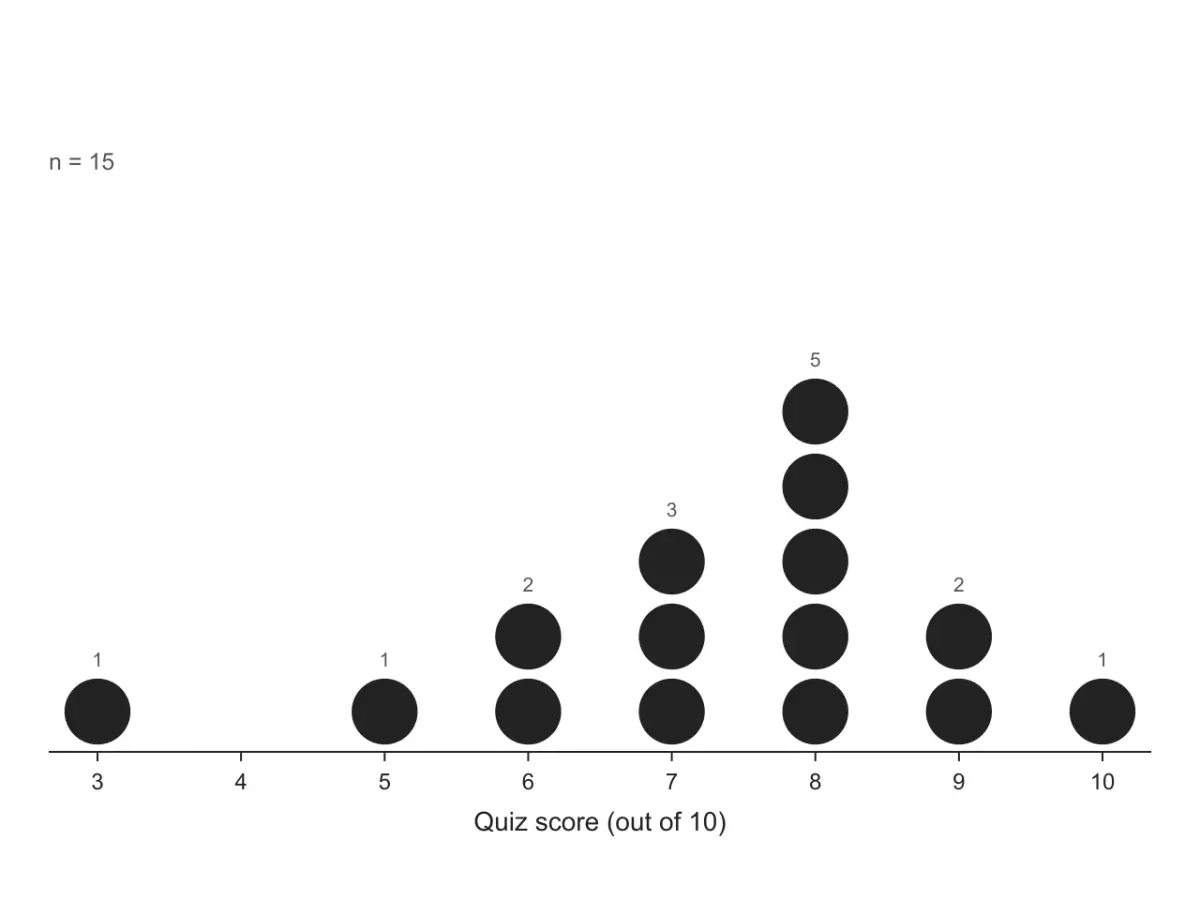
Fifteen scores out of 10, one dot per student. The tallest stack is at 8 (the mode), nobody scored 4 (a gap), and the single dot at 3 sits apart from the rest.
Enter or paste a list of numbers and get a dot plot: stacked dots above a labeled number line, with the mean, median, mode and range.
1 group · 15 values · read as a single group
Pasted numbers or a CSV file, numbers only · free to plot · download PNG (300 DPI) or SVG
Leave empty to stack equal values. With many different values (decimals, measurements), type 1, 5 or 0.5 to round to the nearest multiple before stacking.
| Group | n | Mean | Median | Mode | Range | Min | Max |
|---|---|---|---|---|---|---|---|
| — | 15 | 7.27 | 8 | 8 | 7 | 3 | 10 |
| Value | Frequency | Relative frequency |
|---|---|---|
| 3 | 1 | 6.7% |
| 5 | 1 | 6.7% |
| 6 | 2 | 13.3% |
| 7 | 3 | 20% |
| 8 | 5 | 33.3% |
| 9 | 2 | 13.3% |
| 10 | 1 | 6.7% |
| Total | 15 | 100% |
The plot is computed on this page as you type. When you download it, the data and settings are saved to your history so you can reopen and edit the plot later.
Each figure below is what this dot plot maker draws from the sample data in the tool, unedited. The datasets are made up for demonstration. Open one in the tool to see its numbers and change any setting.
Fifteen scores out of 10, one dot per student. The tallest stack is at 8 (the mode), nobody scored 4 (a gap), and the single dot at 3 sits apart from the rest.
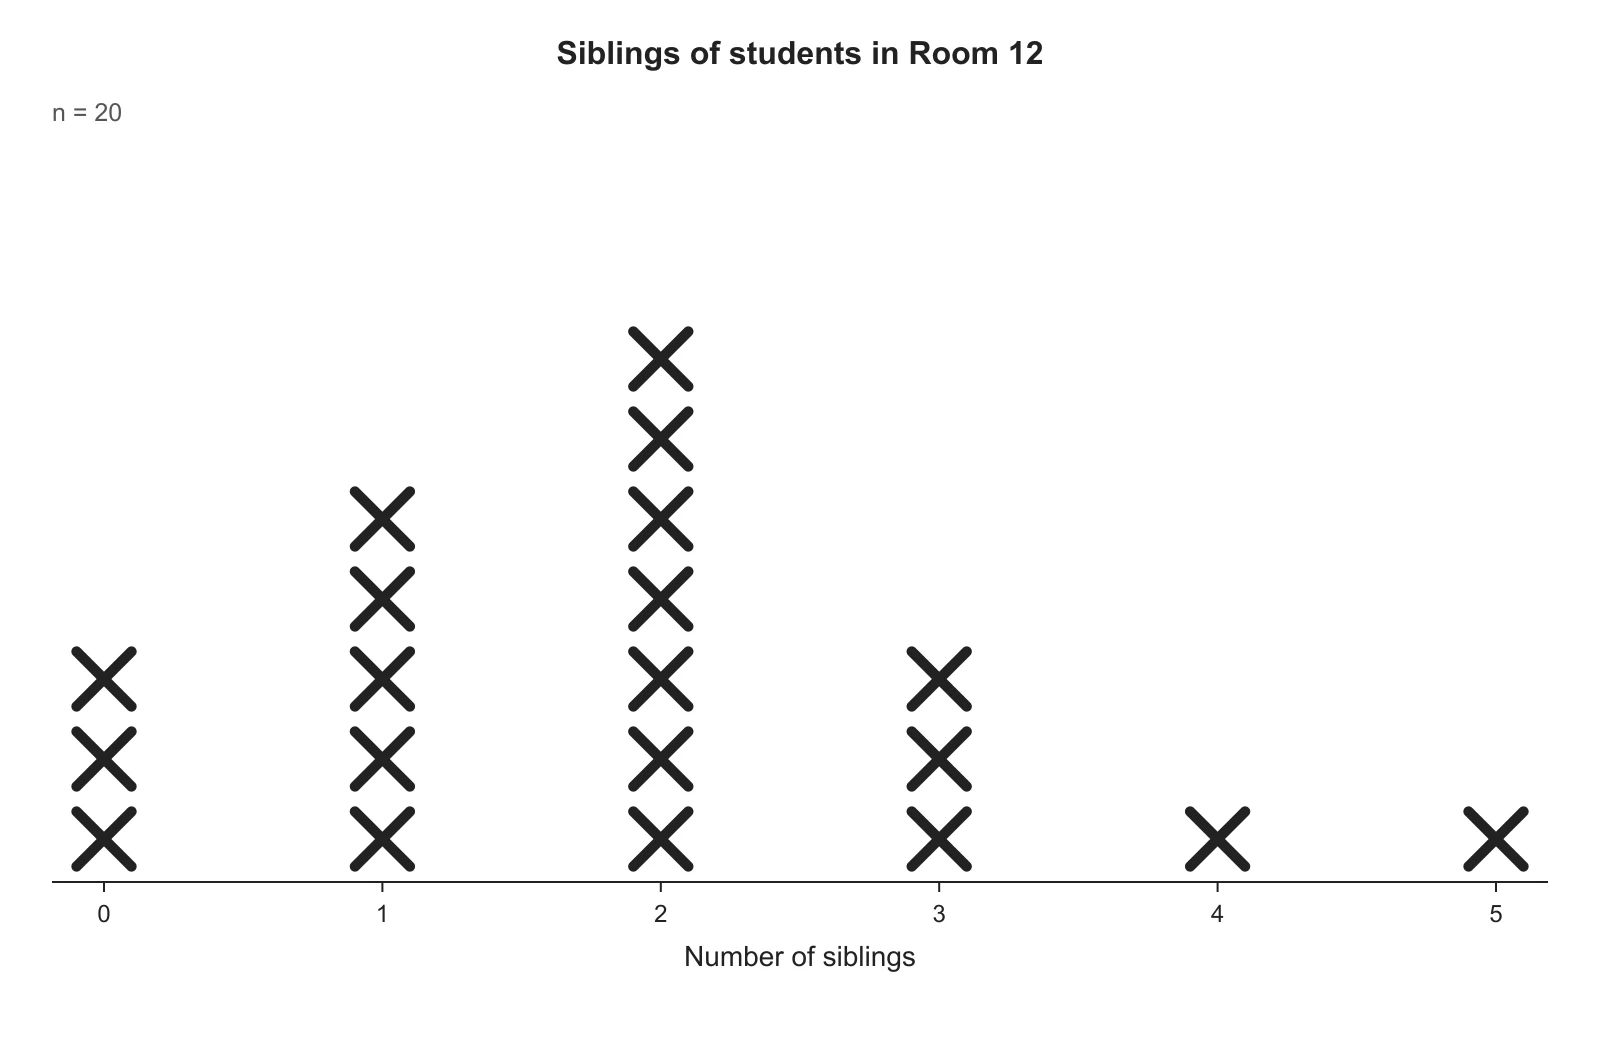
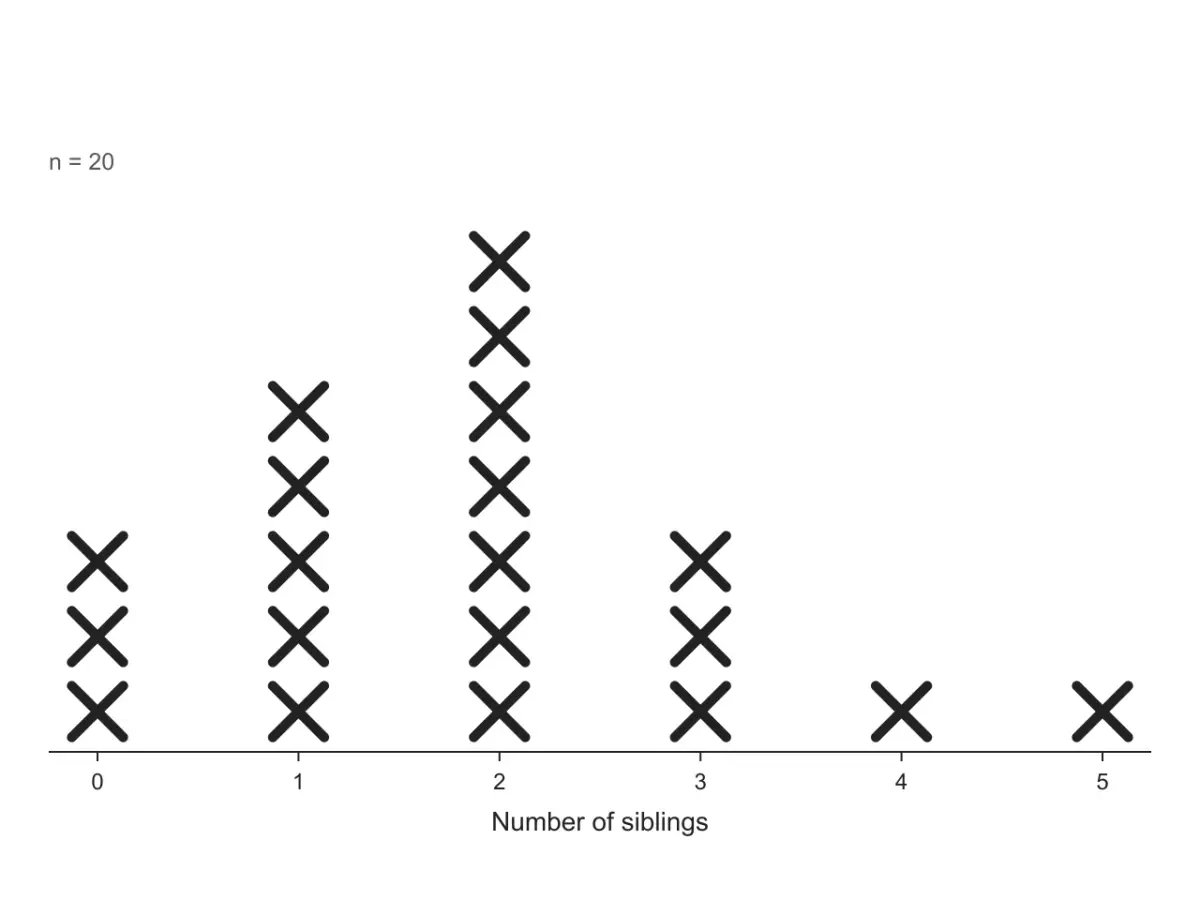
Number of siblings for 20 students, drawn the way elementary math books draw a line plot: an X for each answer above a number line, in black for printing.
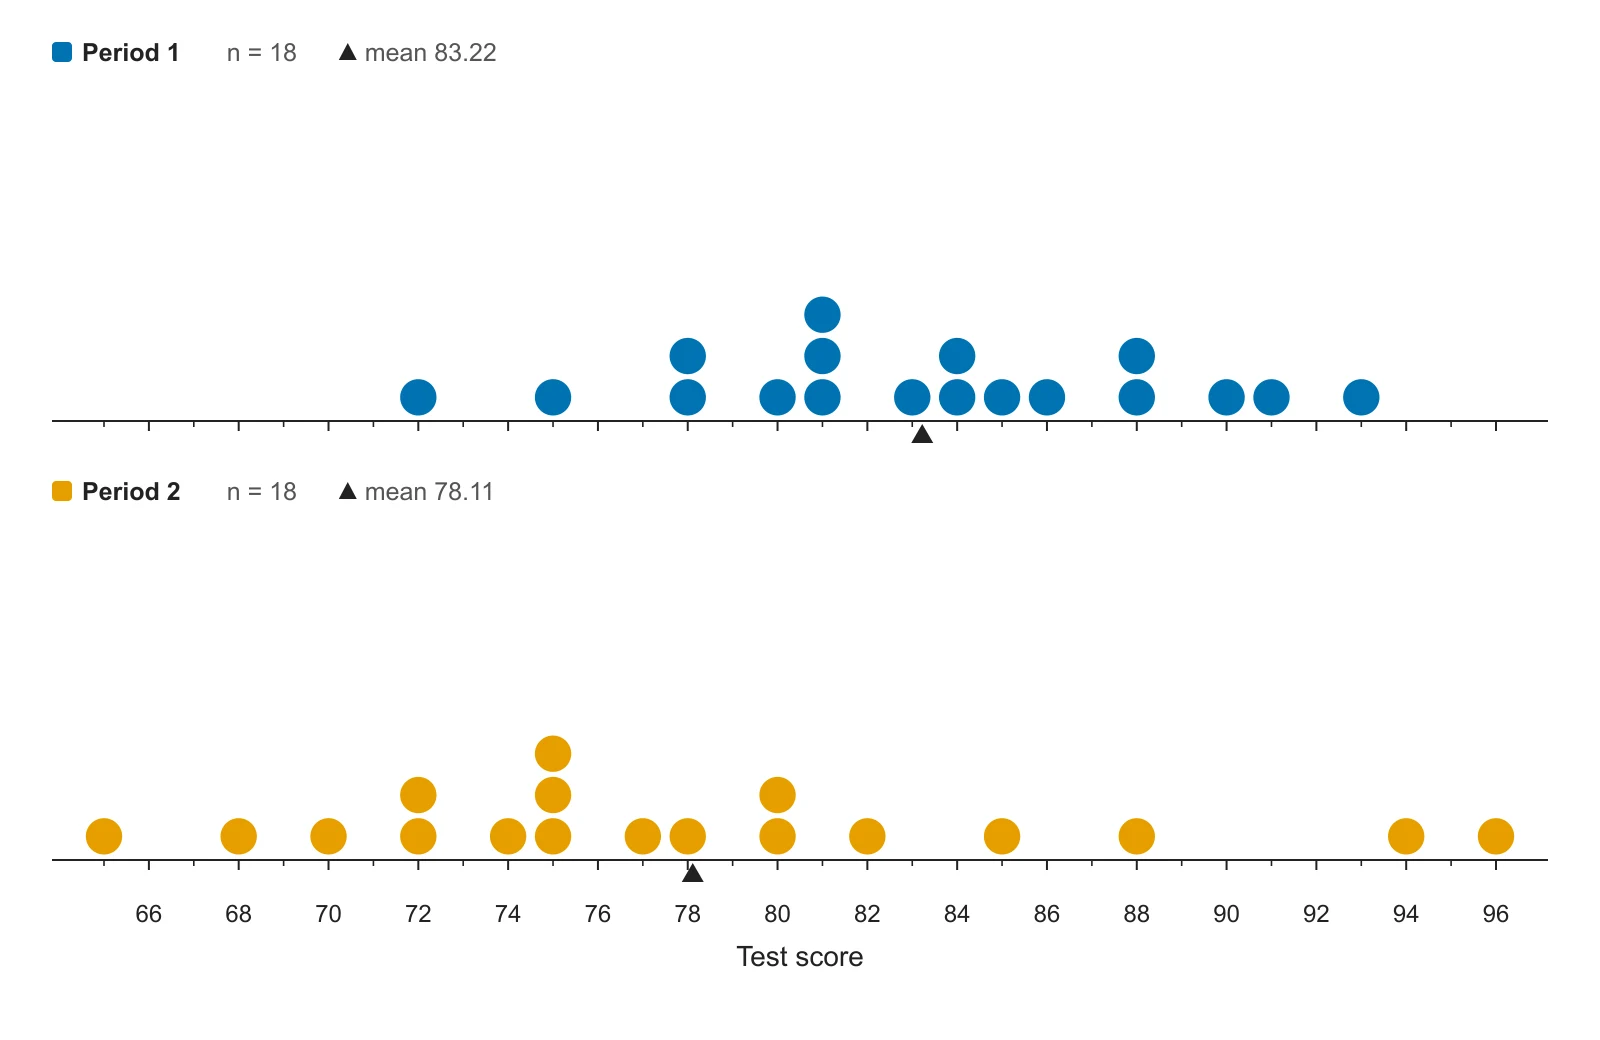
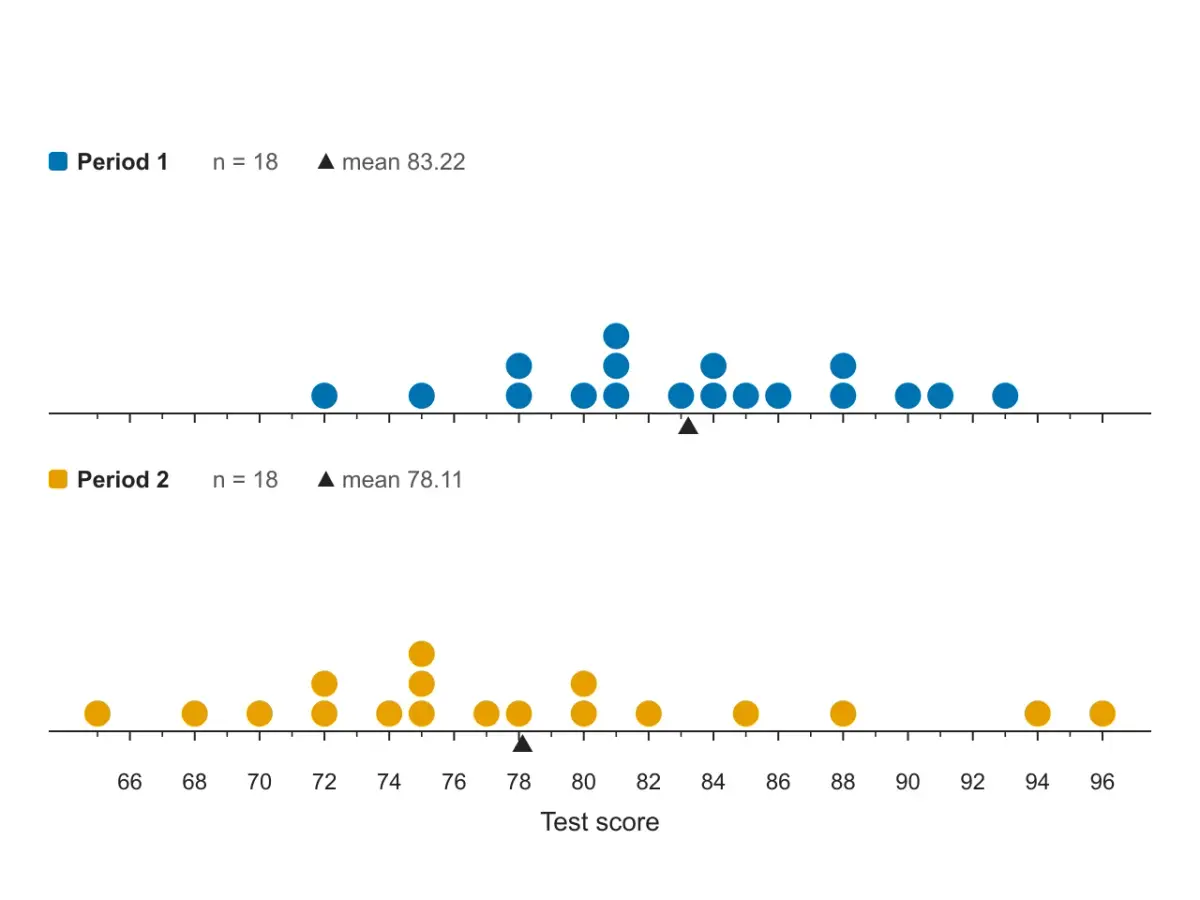
Test scores for two class periods, stacked on the same number line so the scales match. Period 1 sits further right and is more tightly packed; the triangle marks each mean.
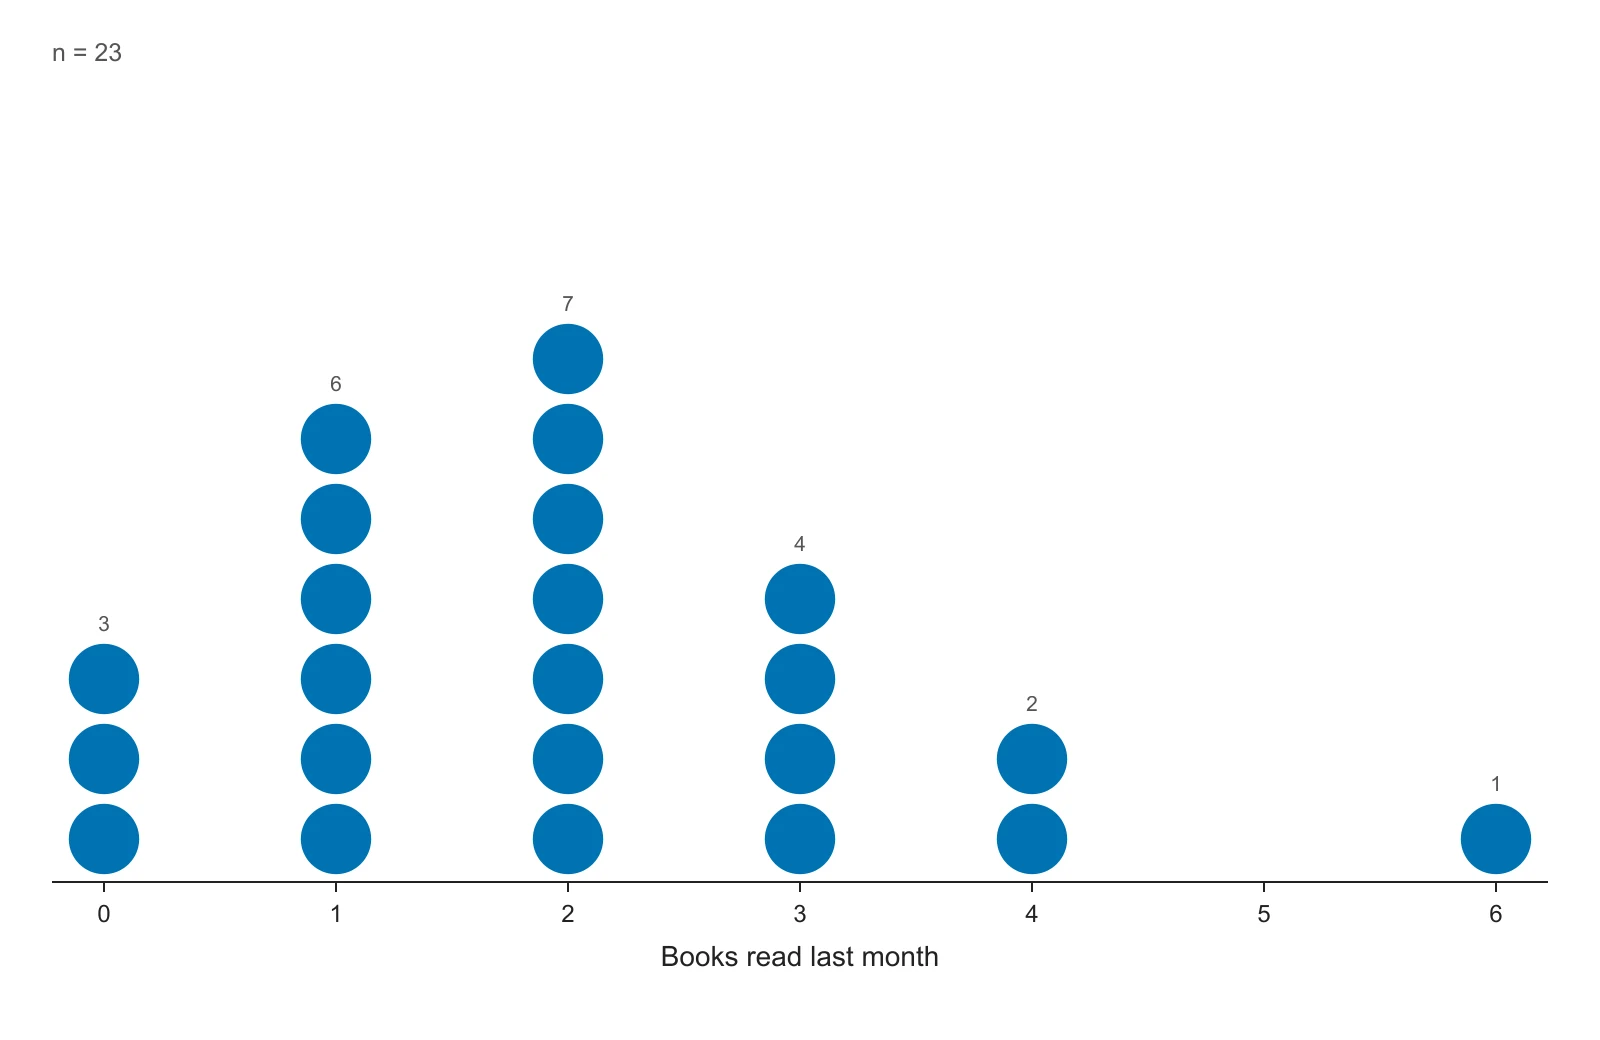
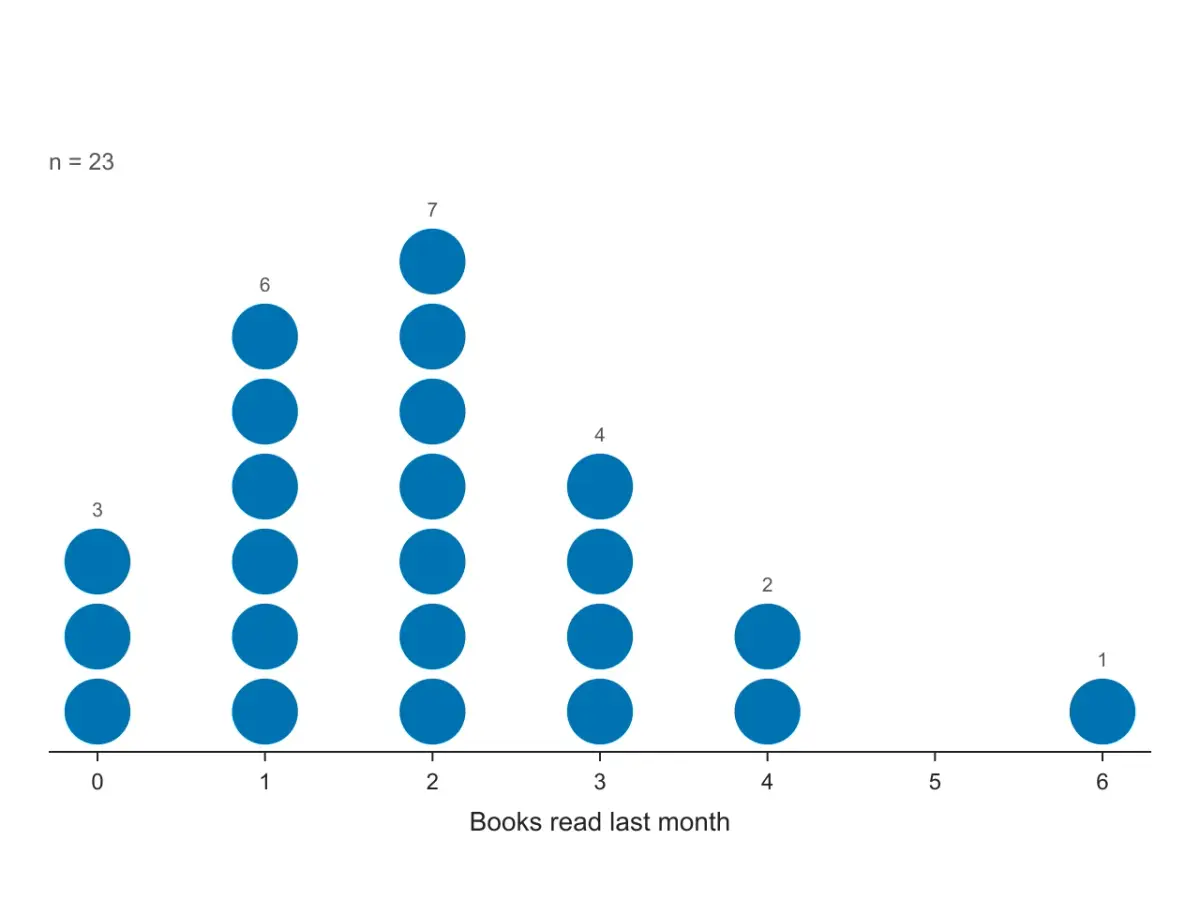
Books read last month, typed as value and count: 0 three times, 1 six times and so on. The count is written above each stack, and 5 stays empty because nobody read five books.
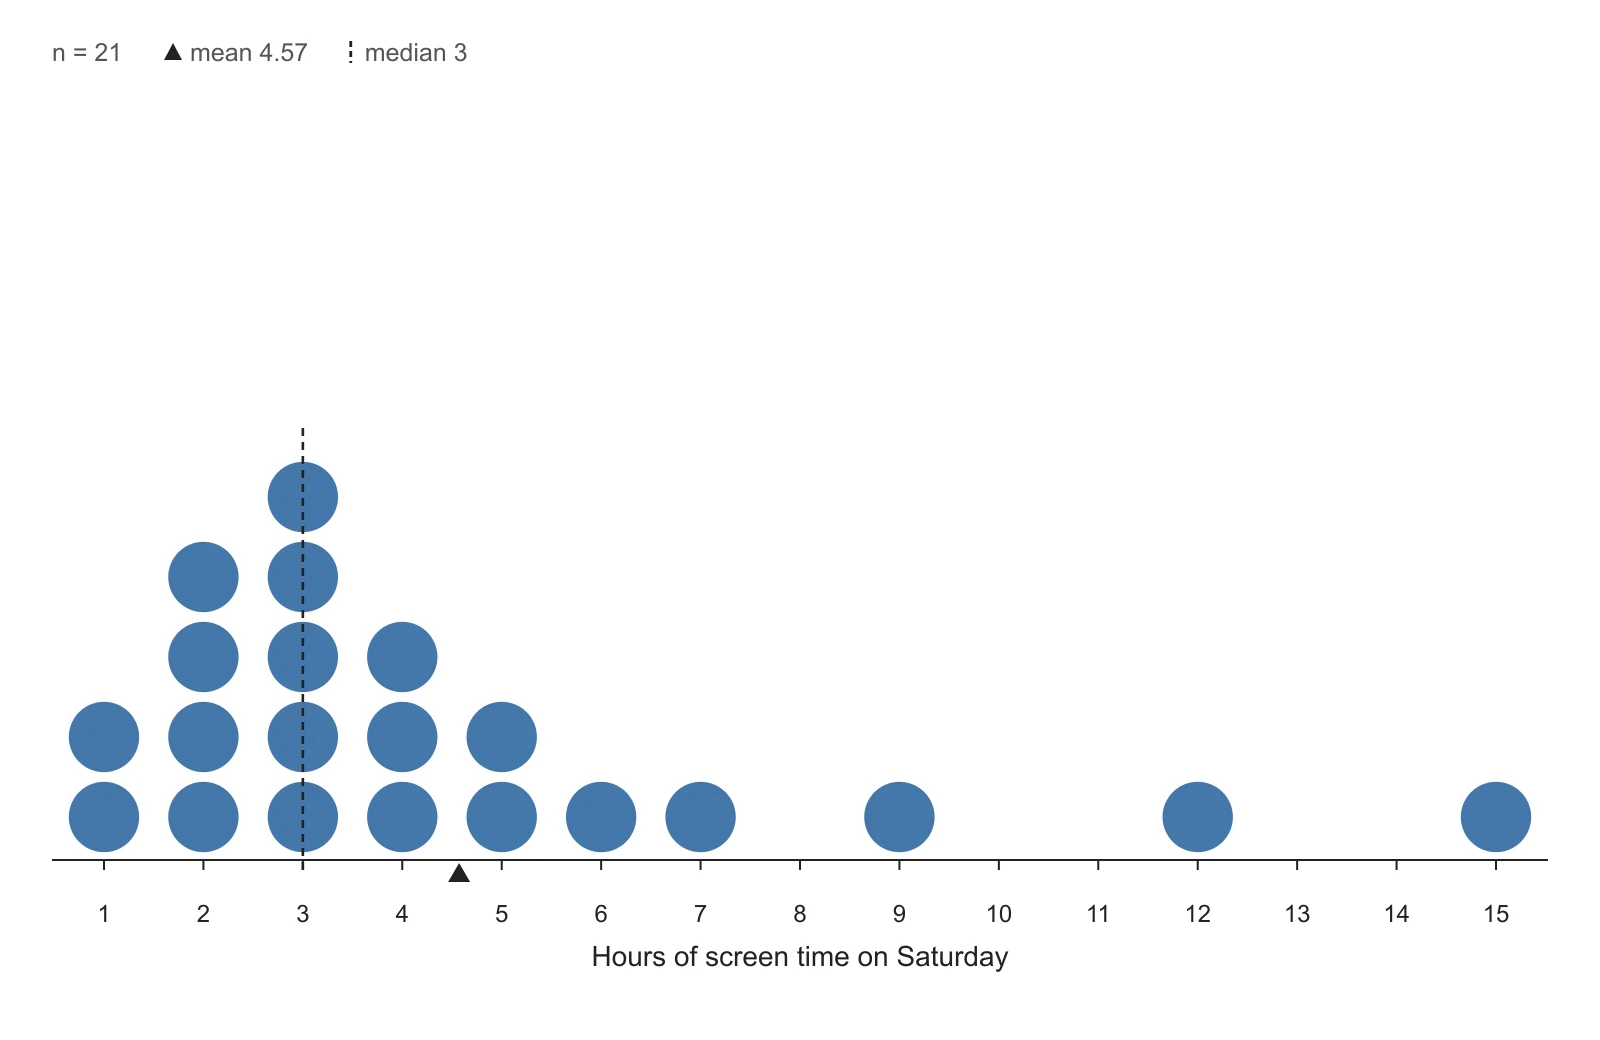
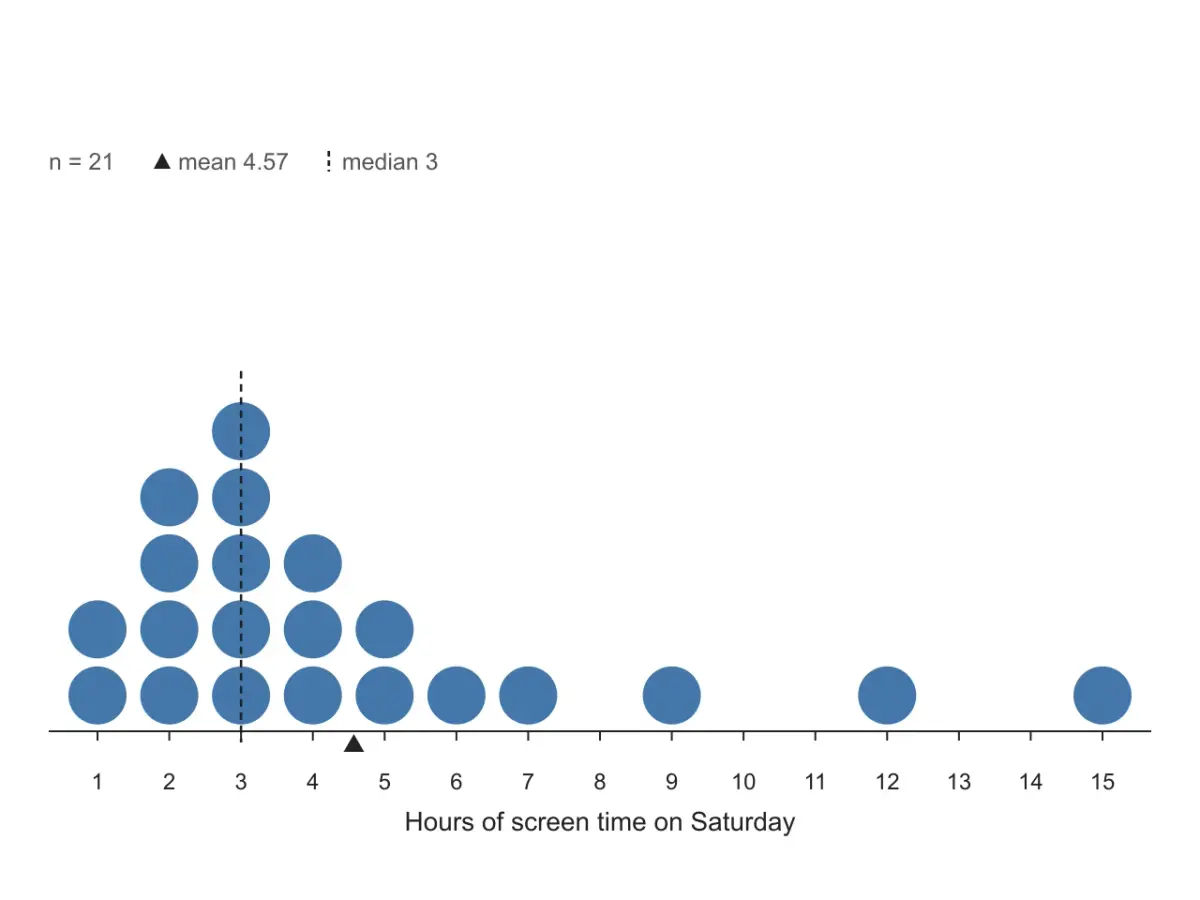
Hours of screen time with a long tail to the right. The few large values pull the mean (triangle, 4.57) above the median (dashed line, 3): the sign of a right-skewed distribution.
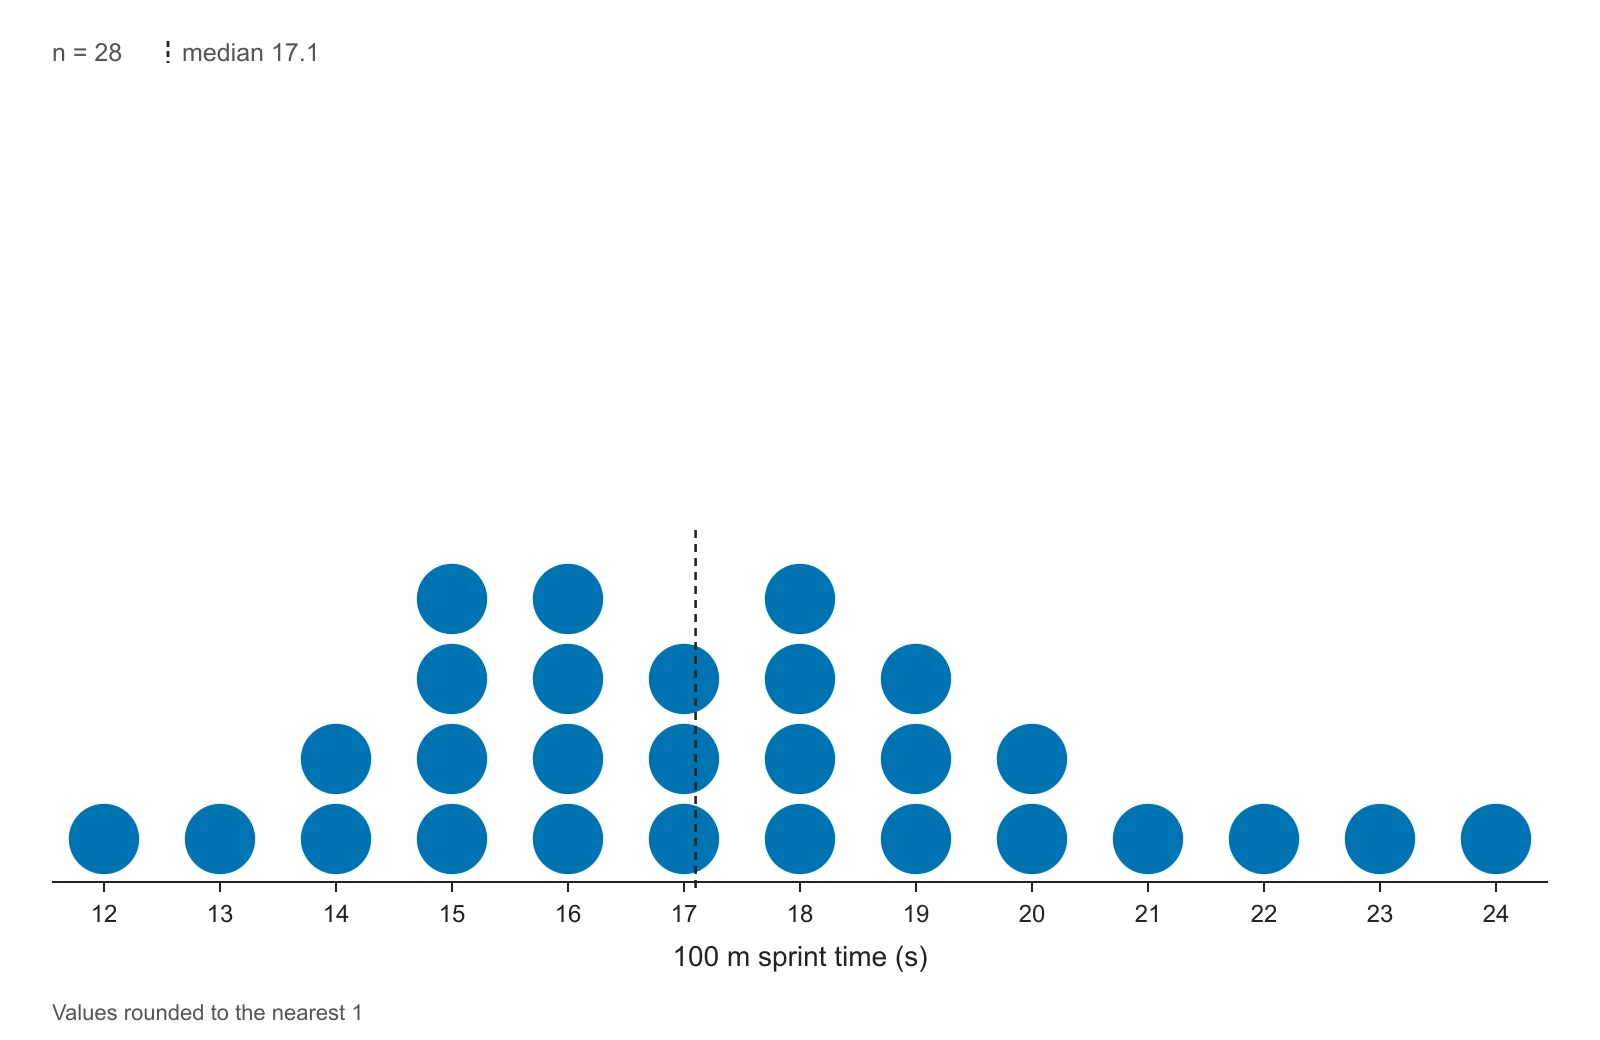
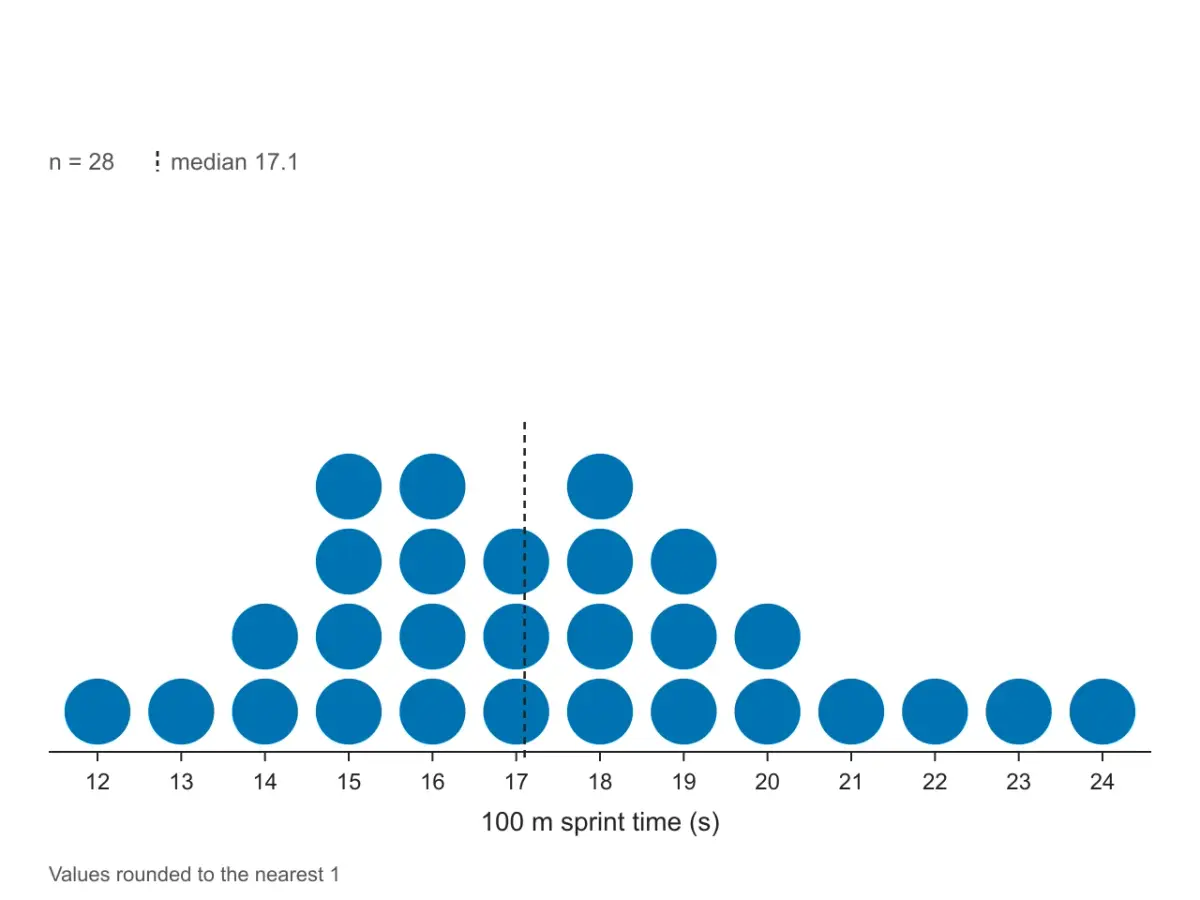
Twenty-eight 100 m sprint times measured to a tenth of a second. Almost every value is different, so each is rounded to the nearest second before stacking, and the plot says so.
A dot plot is a chart that shows a set of numbers as dots stacked above a number line: each dot is one data value, and the height of a stack is how many times that value occurs (its frequency). Because every value is still visible, you can read the mode (the tallest stack), the range (from the leftmost to the rightmost dot), clusters, gaps and unusual values straight off the picture.
Dot plots work best for small sets of numerical data, where you can still count the dots: the scores of one class, or the answers to a short survey. The Common Core standards for grade 6 ask students to “display numerical data in plots on a number line, including dot plots, histograms, and box plots” (6.SP.B.4), and AP Statistics uses the same display under the spelling dotplot. In grades 2 to 5 the same chart, usually drawn with X marks, is called a line plot.
Stacked dot plots were drawn by hand long before software; Leland Wilkinson's 1999 paper “Dot Plots” set out how to draw them by computer, which is why statisticians sometimes say Wilkinson dot plot to tell this chart apart from the Cleveland dot plot (or dot chart), which compares labeled categories instead.
To make a dot plot, draw a number line that covers your smallest and largest values, then put one dot above the number line for each data value, stacking dots when a value repeats. Here are the five steps on one small dataset: the quiz scores of 15 students, out of 10.
Data7, 8, 6, 9, 8, 10, 7, 8, 5, 9, 8, 7, 6, 8, 3
The lowest score is 3 and the highest is 10, so the number line has to run from 3 to 10.
Mark every whole number from 3 to 10 at equal spacing, including 4 even though nobody scored it. Leaving a value out would hide the gap and squeeze the picture. Write what the numbers mean under the line: Quiz score (out of 10).
Go through the list once and tally each score. This is the frequency table for the data:
| Score | Tally | Frequency |
|---|---|---|
| 3 | | | 1 |
| 5 | | | 1 |
| 6 | || | 2 |
| 7 | ||| | 3 |
| 8 | |||| | 5 |
| 9 | || | 2 |
| 10 | | | 1 |
| Total | 15 | |
Above 8 draw five dots, above 7 three dots, and so on. Keep the dots the same size and the same distance apart, so that the height of a stack can be compared with its neighbors. For a line plot, draw an X instead of each dot.
Count the dots: there should be 15, one per student. Then read the plot: the tallest stack is at 8 (the mode), the scores run from 3 to 10 (a range of 7), most students scored between 6 and 9, and the dot at 3 stands apart from the others.
Three steps in your browser
Three steps in this dot plot maker. The plot redraws as you type, so you can try a setting and see the effect straight away.
Paste a list of numbers, columns copied from Excel or Google Sheets (one group per column, names in the first row), or open a CSV file. Have a frequency table instead? Switch to Frequency table and type each value with its count. Numbers buried in a word problem? Paste it into Describe with AI.
Pick dots or X marks, mark the mean and the median, write the count above each stack, and type a title and a label for the number line. For decimals or measurements, round to the nearest 1, 5 or 0.5 so that close values stack.
Download a 300 DPI PNG for Google Docs, Word or slides, or an SVG whose text stays editable. Copy the table of mean, median, mode and range, open the frequency table, or open Show steps to check each calculation against your own working.
Describe a dot plot the way AP Statistics asks you to describe any distribution: its shape, center and variability (spread), plus unusual features such as outliers, gaps or clusters, always in the context of what was measured.
To compare two groups, draw them on the same number line (paste one column per group) and compare where each group is centered and how spread out it is, in that order.
A dot plot keeps every value, so all four can be read from it:
| Measure | How to find it on the plot | Quiz-score example |
|---|---|---|
| Mode | The value under the tallest stack. Two stacks tied for tallest means two modes. | 8 (five dots) |
| Range | Rightmost value minus leftmost value. | 10 − 3 = 7 |
| Median | Count the dots (n). With an odd n, the median is dot number (n + 1) ÷ 2 counting from the left; with an even n, average the two middle dots. | 15 dots, so the 8th dot: 8 |
| Mean | Multiply each value by the number of dots above it, add the products, and divide by n. | (3 + 5 + 12 + 21 + 40 + 18 + 10) ÷ 15 = 109 ÷ 15 ≈ 7.27 |
The table under the plot gives the same four numbers for your data, and Show steps writes out the working: the sorted list, the count for each value, the sum, and which position the median is at. If every value occurs the same number of times, the tool reports no mode.
Use a dot plot when the data are numbers and the set is small enough to count the dots. Use a histogram for hundreds of values or values that rarely repeat, a box plot to compare several groups by median and spread, and a bar graph when the data are categories.
| Chart | What it shows | Use it when |
|---|---|---|
| Dot plot | One dot per value, stacked above a number line | The dataset is small and you want every value visible (until you round) |
| Line plot | The same chart, usually drawn with X marks | You are following a US elementary math book (grades 2 to 5); switch Marks to X marks |
| Histogram | Bars whose height is the count of values in each interval (bin) | The dataset is large, or the values are measurements that rarely repeat. Its shape can change with the bin width you pick |
| Box plot | Five numbers only: minimum, Q1, median, Q3, maximum | You are comparing several groups and care about medians and spread more than individual values |
| Bar graph | One bar per category | The data are categories (favorite color, type of pet), not numbers |
A line plot is not a line graph. A line graph joins points with line segments to show change over time; a line plot is named after the number line it sits on. And a dot plot is not a scatter plot: a scatter plot needs two numbers per subject (x and y), a dot plot only one. For paired data use the scatter plot maker; to see the full shape of several large groups, use the violin plot maker.
You can paste four layouts: a single list, one column per group, group and value pairs, or a frequency table of values and counts.
| Layout | Looks like | Use when |
|---|---|---|
| A single list | 7, 8, 6, 9, 8 or one number per line | One set of numbers, as in most textbook exercises |
| One column per group | Period 1, Period 2 in row 1, values below | You copied columns out of Excel or Google Sheets and want to compare groups |
| Group + value | group, value per row, e.g. Period 1, 84 | Data exported from a form, R or Python |
| Frequency table | 0, 4 then 1, 7: a value and how many times it occurs | The problem gives a table of values and counts instead of a list |
Tabs (what spreadsheets copy), commas, semicolons and spaces all work for raw data, and cells that are not numbers are skipped and counted under the box. Frequency tables go in the Frequency table tab; a header row such as books, students is used as the label of the number line.
The tool plots numbers on a number line. It does not plot categories written as words (colors, pets, sports) and does not draw fraction labels such as ¼ and ½: type fractions as decimals (0.25, 0.5) and set Round values to to the step of your number line.
With whole numbers that repeat, such as scores or counts, dots stack on their own. With decimals or measurements (heights, times, prices) nearly every value is unique, and a dot plot of the exact values is a single flat row. The usual fix is to round each value to a convenient step before stacking: type 1, 5 or 0.5 in Round values to. The plot then carries the note Values rounded to the nearest …, and the mean, median, mode and range in the table are still computed from your exact values.
If you leave the box empty and the data have more than 60 different values, the tool picks a step for you. With a few hundred values, a stack can also get too tall to draw; the tool then lets one dot stand for several values and writes that on the plot. At that size a histogram usually tells the story better.
=REPT("●", count).L = [7, 8, 6, 9, 8], then type dotplot(L) (Desmos data visualizations).DotPlot({7, 8, 6, 9, 8}) returns one point per value, stacked where values repeat (GeoGebra manual).stripchart(x, method = "stack", pch = 19) in base R, or ggplot(df, aes(x)) + geom_dotplot().Use this page when you need the figure now, want the mean, median, mode and range checked against your own working, or want two groups on the same number line without building helper columns. For diagrams that are not data plots, Vizcept's AI scientific figure generator draws them from a description.
Built for answers you can check
Every dot is placed on this page from the numbers in the data box. AI only reads your text into numbers when you ask it to; nothing is drawn by an image model, so the number of dots in each stack is exactly the count in your data.
 Marks
Dot plot or line plot
Switch between filled dots and the X marks used for line plots in elementary math, in color, grayscale or plain black for printing.
 Center
Triangle and dashed line
Mark the mean with a triangle under the number line and the median with a dashed line, with both values written above the plot.
 Compare
Same scale, stacked
Paste one column per group and each gets its own row of dots and its own color above a shared number line, so centers and spreads line up.
 Input
Counts written above each stack
Type raw values, or a value and its count per row when the problem gives a frequency table. Turn on counts to label each stack.
 Decimals
Nearest 1, 5, 0.5 …
Measurements rarely repeat. Round them to a step you choose so they stack, with a note on the plot and exact statistics in the table.
 Export
Docs, slides, worksheets
The SVG keeps real text, so labels stay editable in PowerPoint, Illustrator or Inkscape. The PNG carries 300 DPI and sits at the right size in Word and Google Docs.
FAQ
Paste your numbers, choose dots or X marks, download an editable SVG or a 300 DPI PNG. Free, and drawn in your browser.
Explore more AI diagram tools across subjects — from the same discipline and beyond.
 New
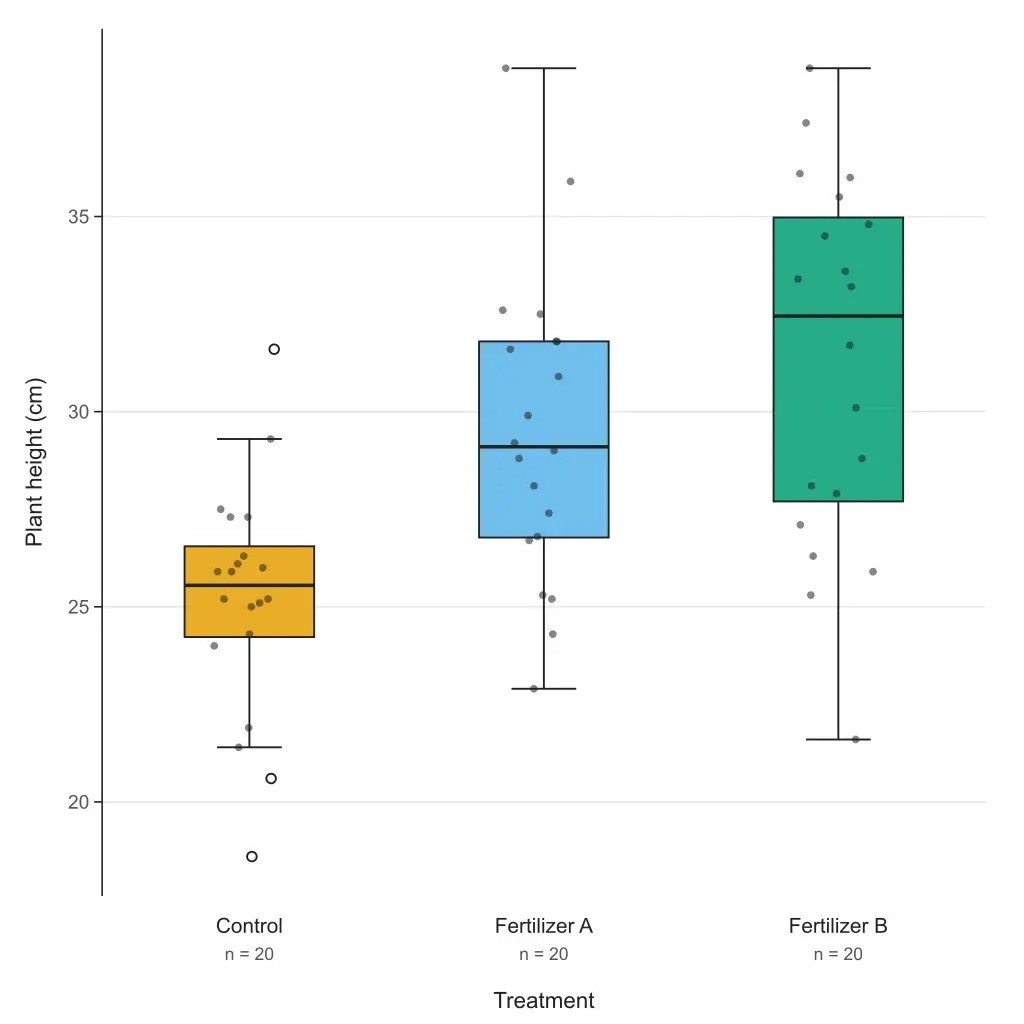
Paste your data or a five-number summary and get a box and whisker plot with quartiles, outliers and labels. Choose the TI-84, Excel or R quartile method; export editable SVG or 300 DPI PNG. Free to paste and download.
 New
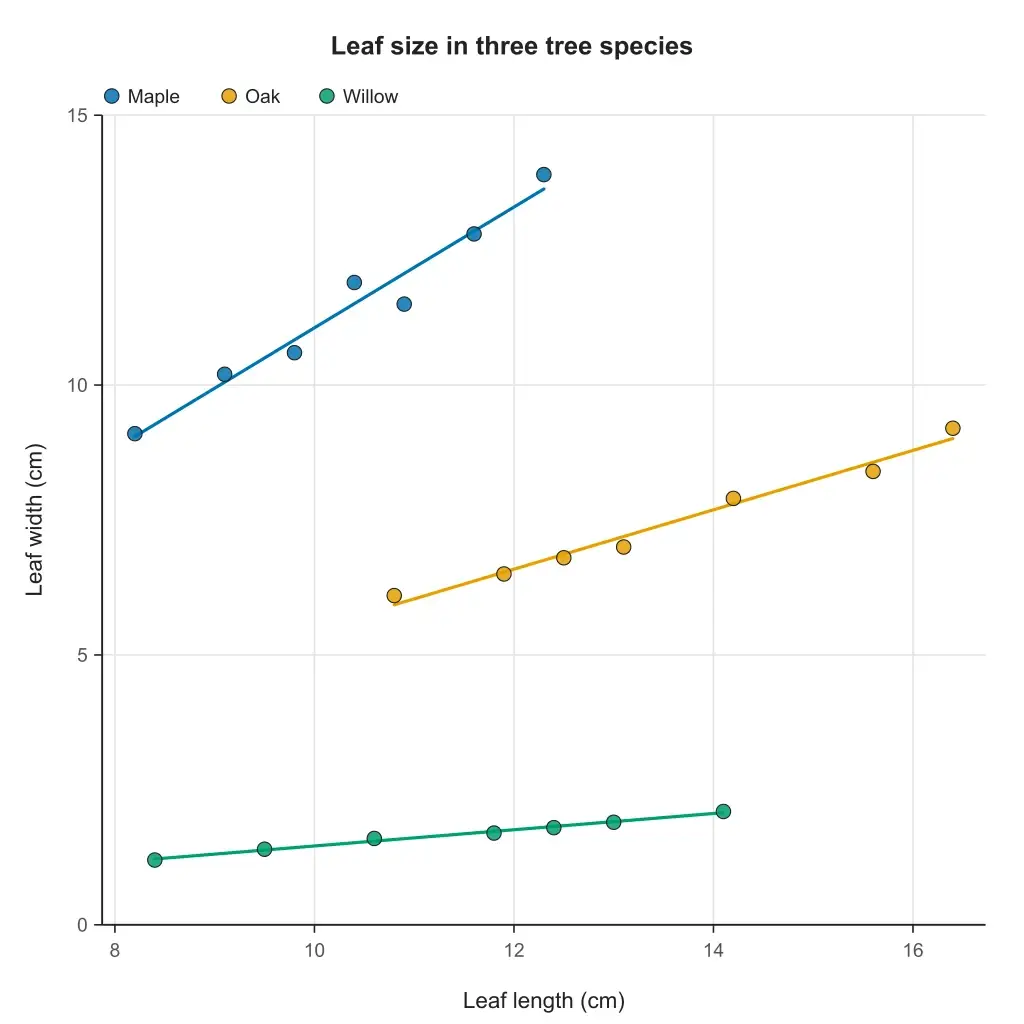
Paste two columns from Excel or a CSV and get a scatter plot with the line of best fit, its equation, r and R². Groups, point labels and step-by-step working; export editable SVG or 300 DPI PNG. Free to paste and download.
 New
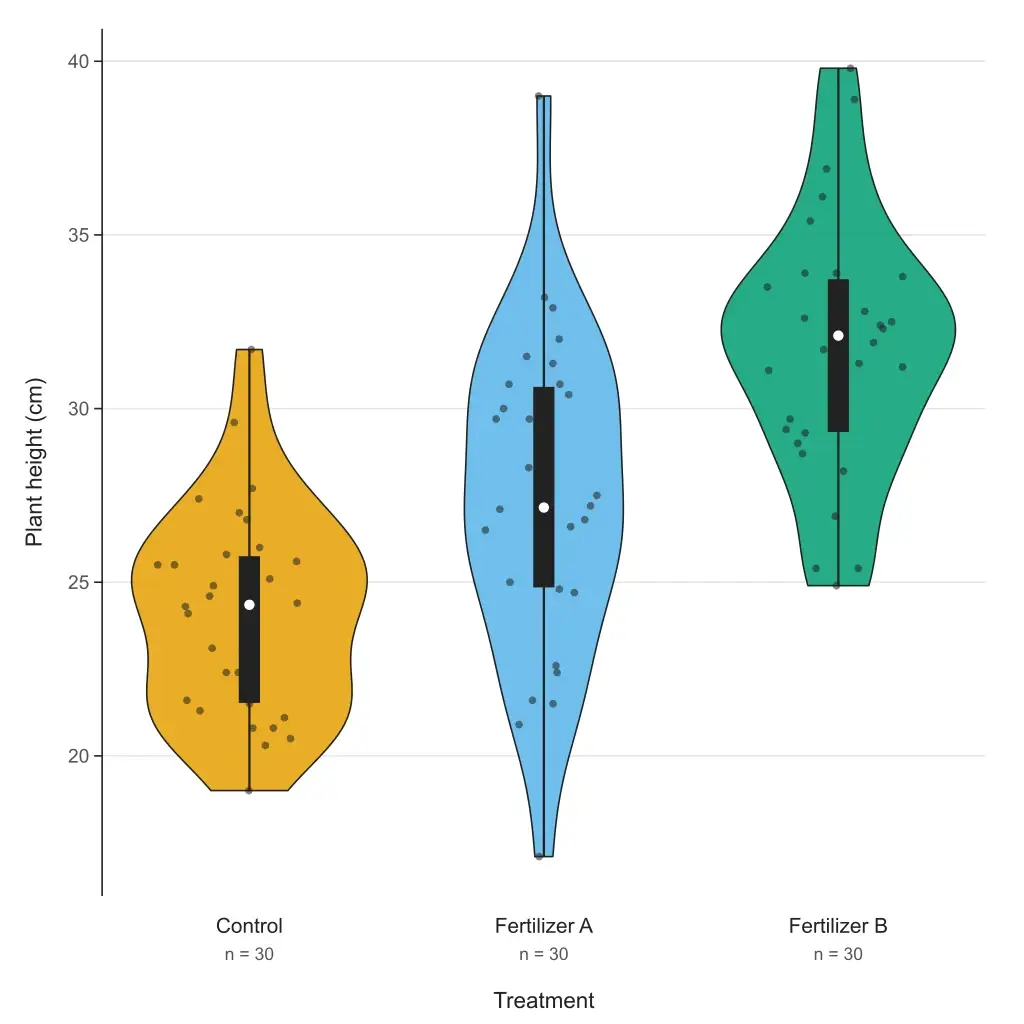
Paste your data and get a violin plot in your browser — grouped or single, box or quartiles inside, adjustable bandwidth, editable SVG and 300 DPI PNG. Free to paste and download; or describe your data and let AI fill it in.
 New
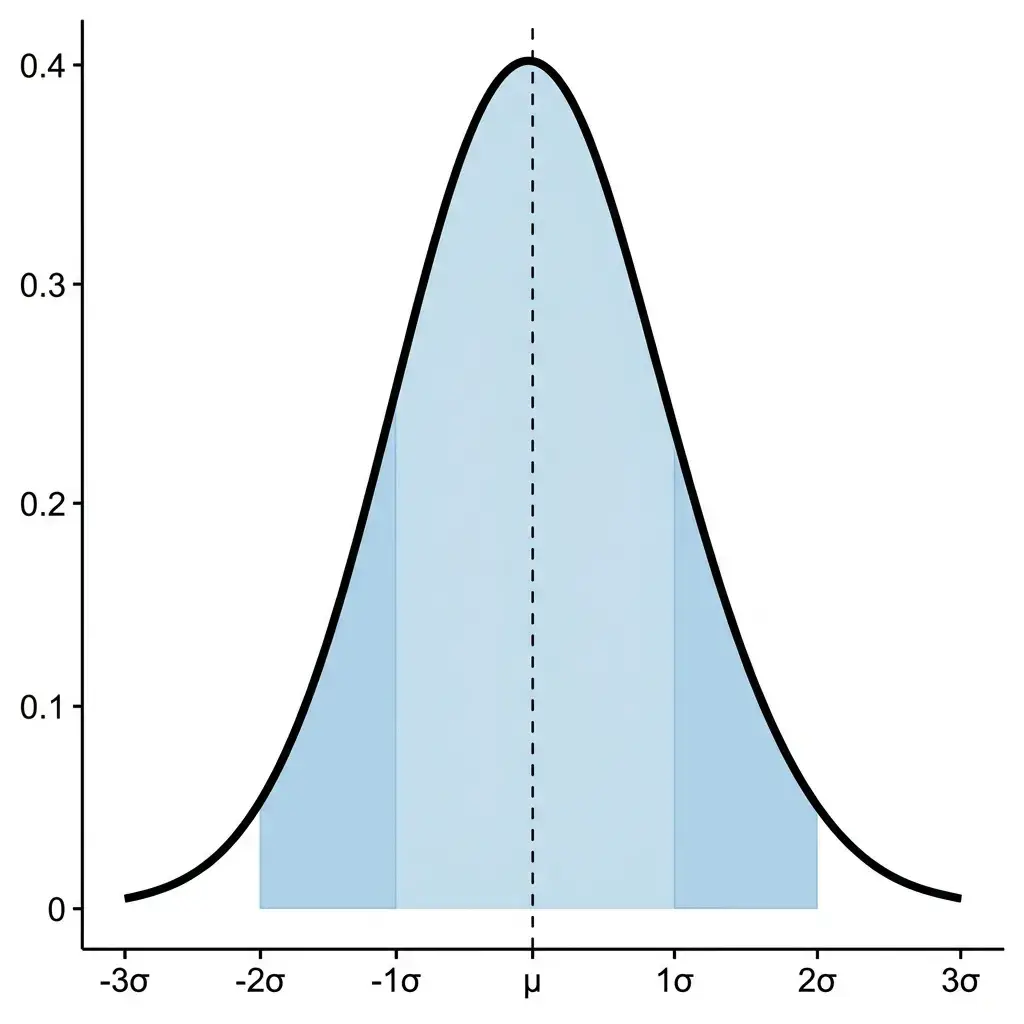
Type a mean and standard deviation, paste data, or set up a confidence interval or hypothesis test, and get an exact normal curve with the shaded area, its probability and the steps.
 New
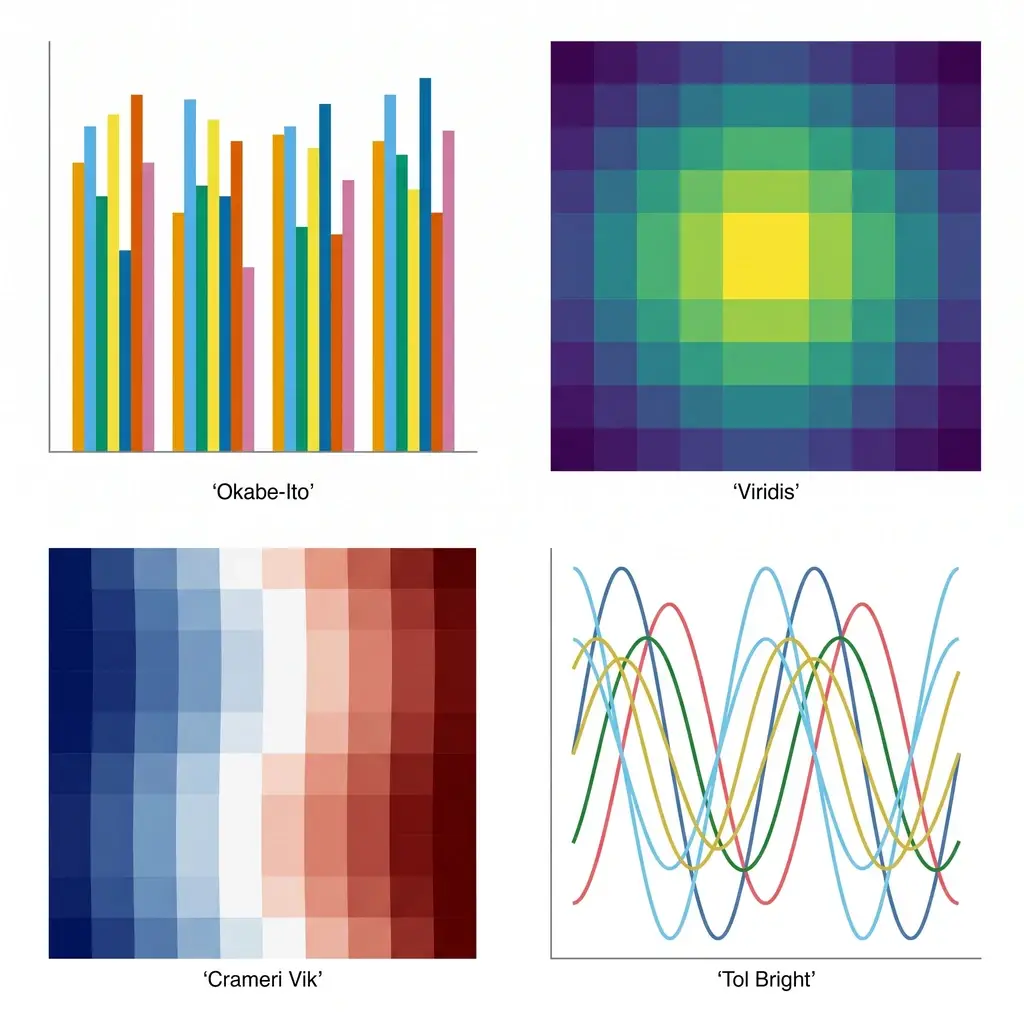
Generate colorblind-safe color palettes for scientific figures — Okabe-Ito, Viridis, Cividis, Crameri Vik, and more — with one-click hex, Python, R, and CSS for journal-ready charts.
 New
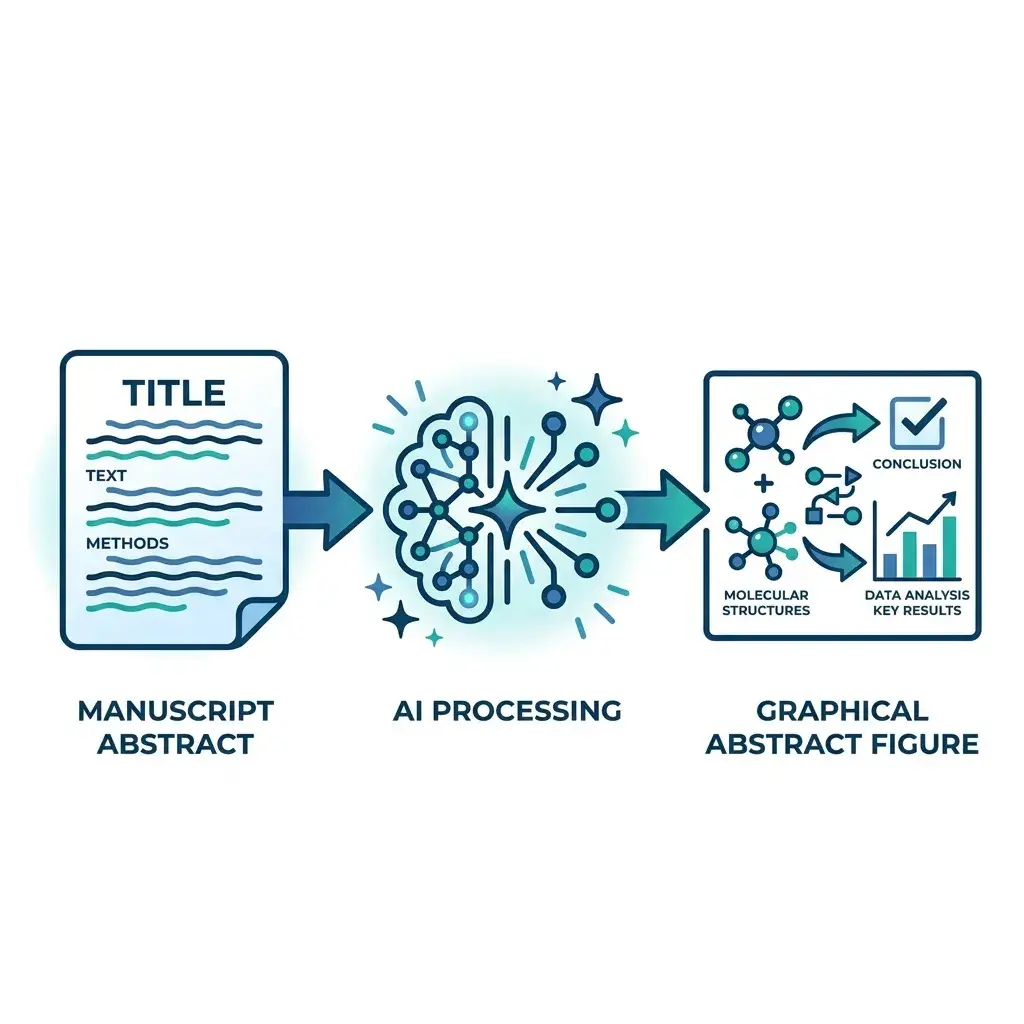
Paste your manuscript abstract — get a journal-ready graphical abstract in Elsevier, Cell Press, Wiley, or ACS dimensions in under a minute.
