Plot digitizer: turn a graph image into data you can redraw

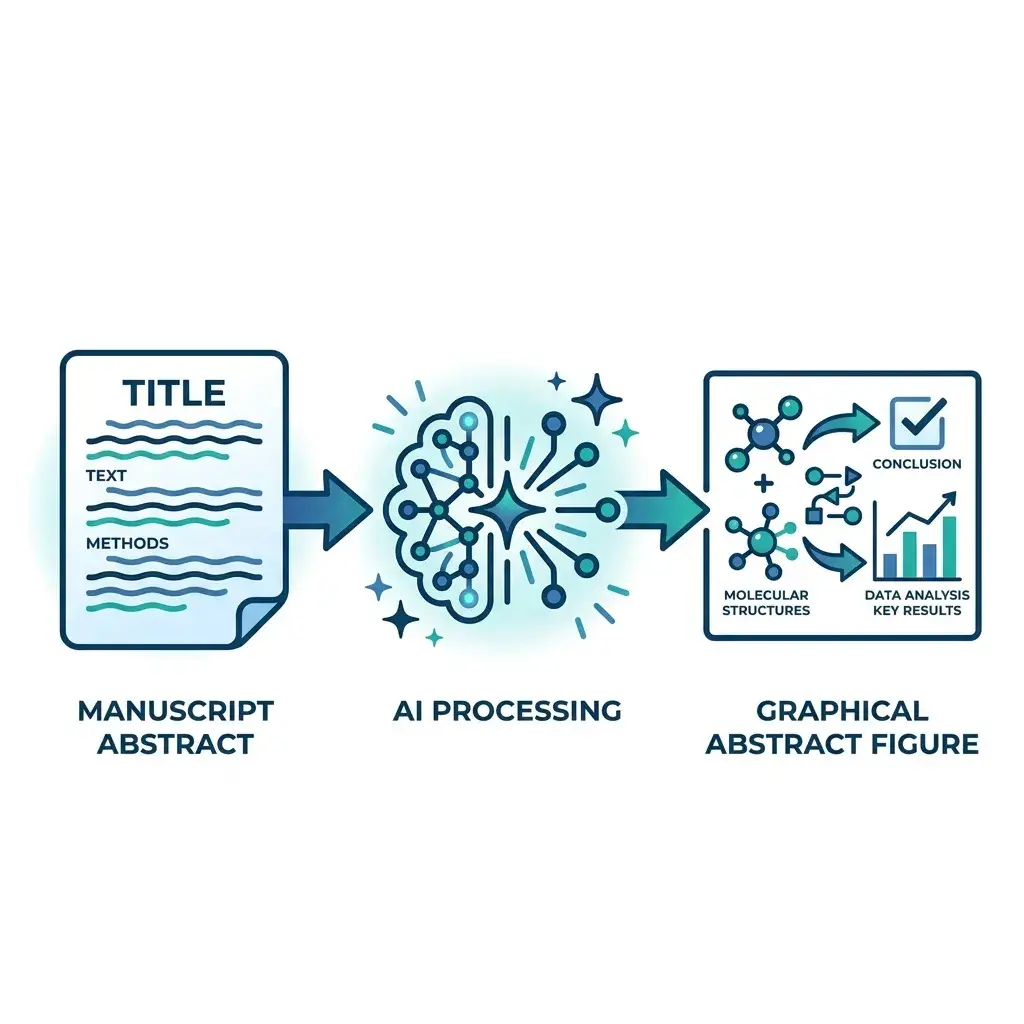
This online plot digitizer takes a chart image, a pasted screenshot, or a figure boxed inside a PDF. The axes and every series come back as a table next to a re-plot, ready for CSV, Excel or a clean new figure.

No clicking on axis pointsImage, screenshot or PDFCSV, Excel, or redraw as a figure
Try a stored example:

The chart image is sent to our AI model to be read and is not stored. A PDF stays in your browser; only the chart you box is sent. The numbers read are saved to your history.

Four charts and the numbers read from them

Each chart below was drawn from made-up data and then read by this plot digitizer. The table and the re-plot are the stored result of that reading, shown as it came back, without edits.

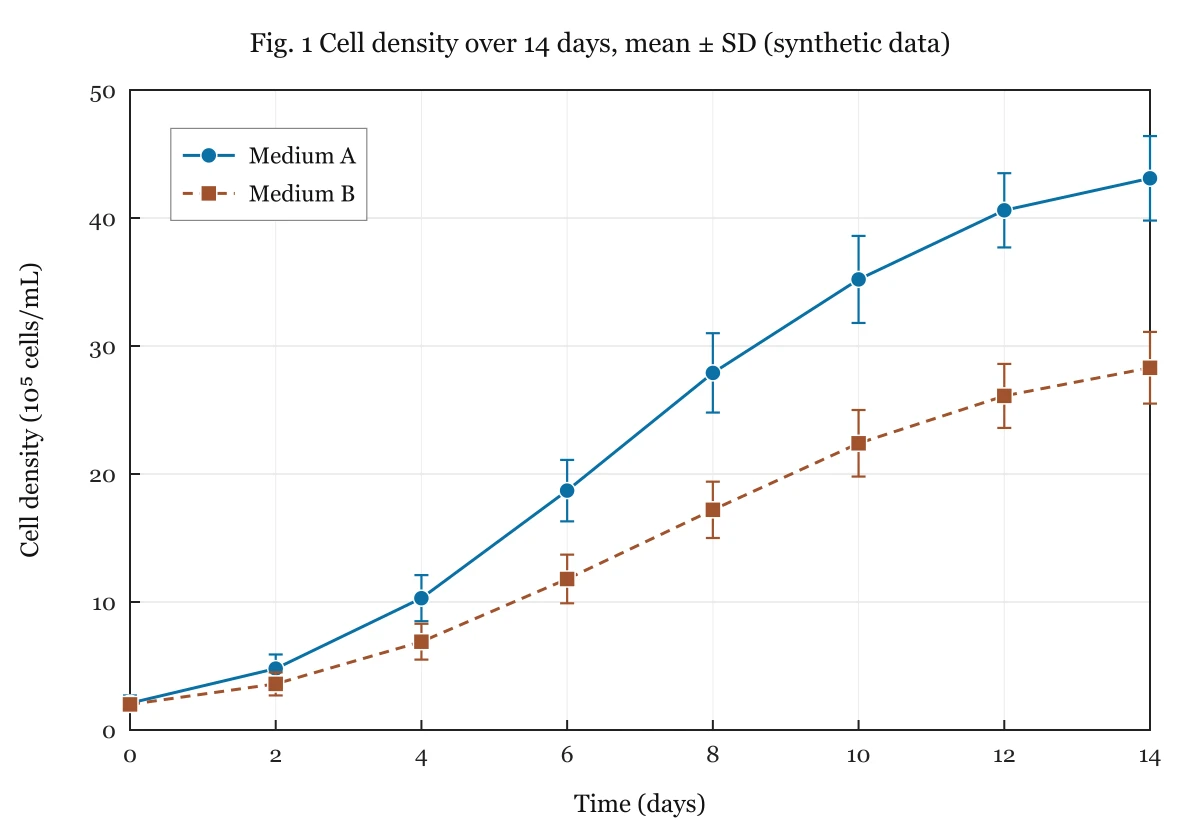
Line chart of cell density over 14 days for two media, with error bars on every point
Chart image
01020304050051015Time (days)Cell density (10^5 cells/mL)Medium AMedium B
Re-plot from the data read

Time course with error bars

Two growth curves with mean ± SD. Each point comes back with its mean and the low and high end of the bar, which is what a meta-analysis sheet needs.

Time (days)Medium AMedium A (low)Medium A (high)Medium BMedium B (low)Medium B (high)
02.11.92.421.82.2
24.83.85.93.62.74.4
410.38.512.16.95.58.3
618.716.421.111.89.913.7
827.924.83117.21519.4
2 series, 16 points · 3 more rows in the toolOpen this result in the tool
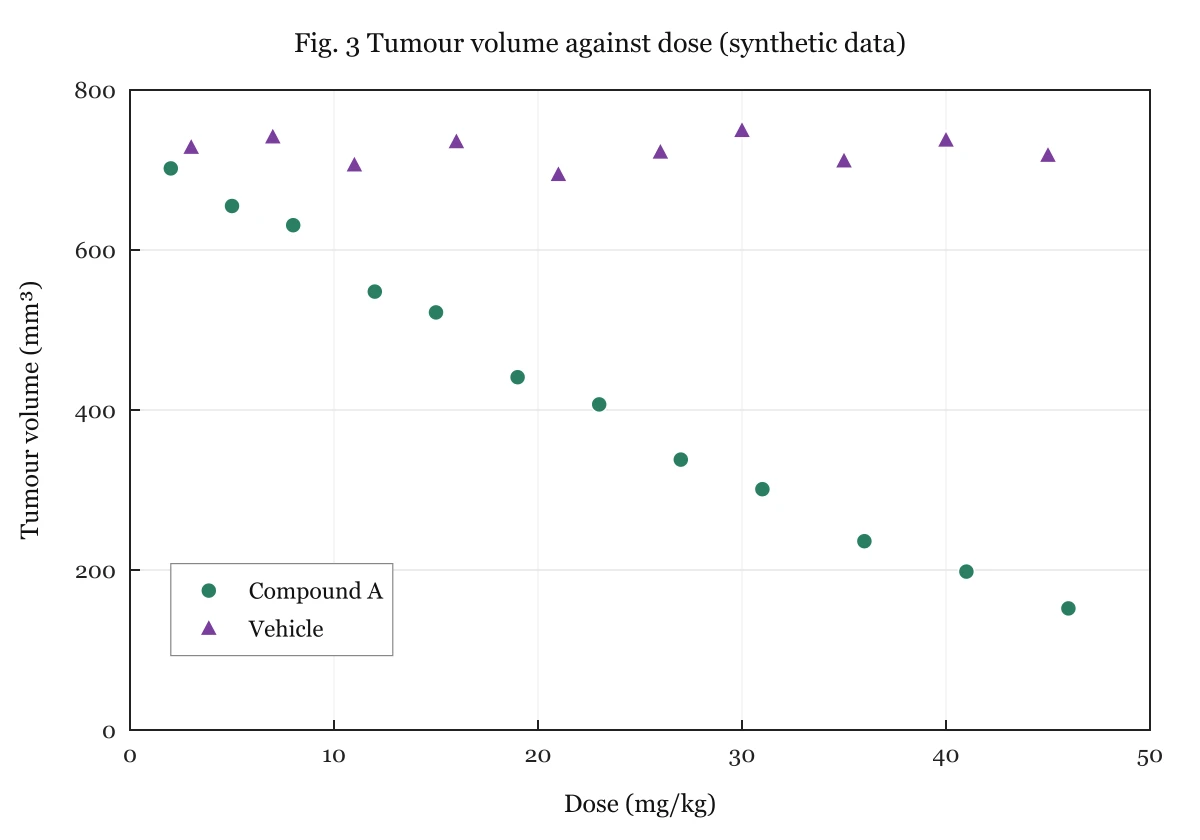
Scatter plot of tumour volume against dose for a treated group and a vehicle group
Chart image
10020030040050060070080001020304050Dose (mg/kg)Tumour volume (mm³)Compound AVehicle
Re-plot from the data read

Scatter plot with two groups

Markers of two shapes, told apart by the legend. Both axes are numeric, so this result can go straight to the scatter plot maker to be redrawn.

Compound A — Dose (mg/kg)Compound A — Tumour volume (mm³)Vehicle — Dose (mg/kg)Vehicle — Tumour volume (mm³)
27033730
56567744
863211709
1254916737
1552321696
2 series, 22 points · 7 more rows in the toolOpen this result in the tool
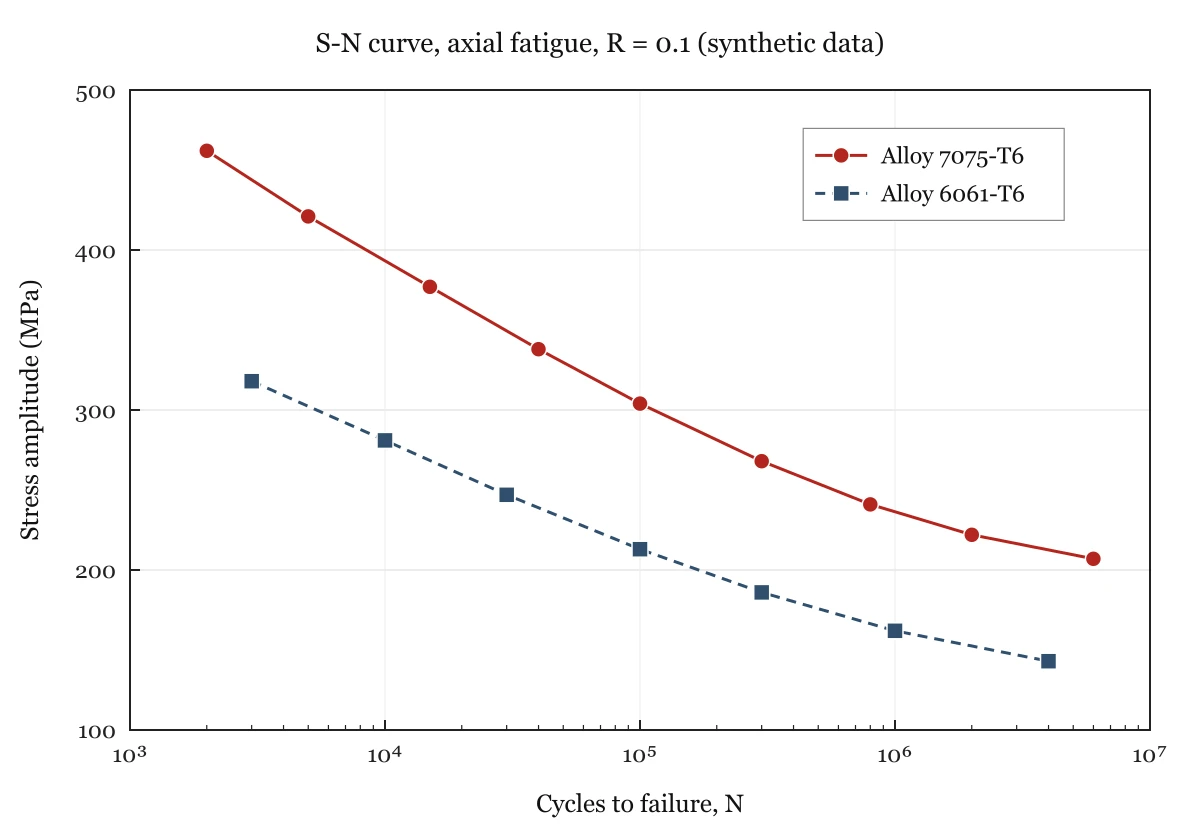
S-N fatigue chart with stress amplitude against cycles to failure on a logarithmic axis for two alloys
Chart image
1002003004005001000100001e51e61e7Cycles to failure, NStress amplitude (MPa)Alloy 7075-…Alloy 6061-…
Re-plot from the data read

Engineering curve on a log axis

An S-N fatigue chart with cycles on a logarithmic x axis, the kind found in a material datasheet. Values are interpolated in log space between the decade ticks.

Alloy 7075-T6 — Cycles to failure, NAlloy 7075-T6 — Stress amplitude (MPa)Alloy 6061-T6 — Cycles to failure, NAlloy 6061-T6 — Stress amplitude (MPa)
20004623000318
500042110000281
1500037730000247
40000338100000213
100000304300000186
2 series, 16 points · 4 more rows in the toolOpen this result in the tool
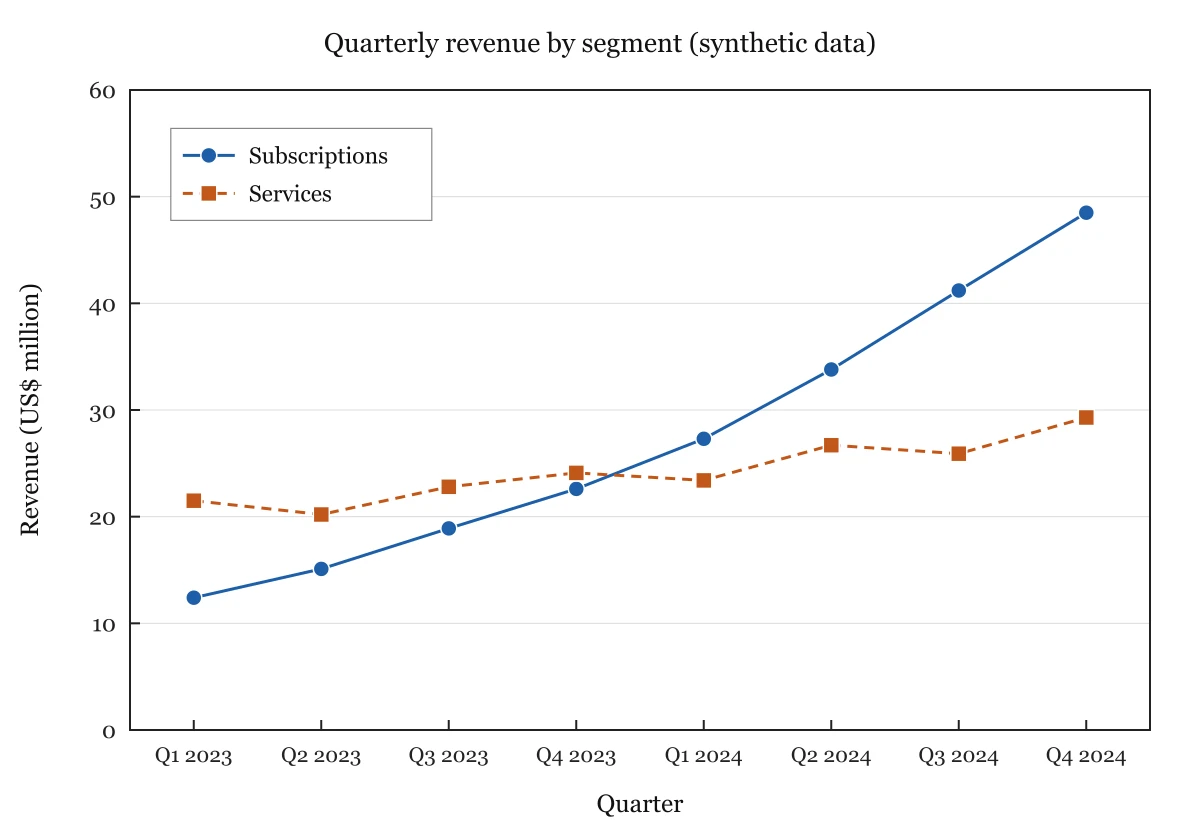
Line chart of quarterly revenue for two business segments over eight quarters
Chart image
1020304050Q1 2023Q2 2023Q3 2023Q4 2023Q1 2024Q2 2024Q3 2024Q4 2024QuarterRevenue (US$ million)Subscriptio…Services
Re-plot from the data read

Revenue chart from a slide

Quarter labels on the x axis instead of numbers, as in an investor deck. The quarters come back as text and each segment gets its own column.

QuarterSubscriptionsServices
Q1 202312.421.5
Q2 202315.120.2
Q3 202318.922.8
Q4 202322.624.1
Q1 202427.423.4
2 series, 16 points · 3 more rows in the toolOpen this result in the tool
What is a plot digitizer?

A plot digitizer is a tool that recovers the numbers behind a chart when all you have is the picture. You give it a line chart, scatter plot or bar chart as an image, and it returns the x and y value of each data point so the data can be analysed, compared or plotted again.

The same tool goes by graph digitizer, graph data extractor or chart to data converter. Classic plot digitizers make you click two known points on each axis, type their values, and then click every data point. This one reads the tick labels, the legend and the points for you, and shows a re-plot so you can see whether it read them correctly.

How to digitize a graph in three steps

From picture to table in about half a minute

It runs online in your browser: nothing to install and no axis to calibrate. One chart goes in at a time.

1

Give It the Chart

Drop a PNG, JPG or WebP on the upload box, or press Ctrl/⌘ + V to paste a screenshot. For a paper or report, open the PDF, go to the page and drag a box around one figure. Crop to a single panel if the figure has several.

2

Read It and Compare

Press Read chart data. The axes, scale type and each legend entry are read, and the data is drawn again beside your image. If the two pictures match, the numbers are right. Where they differ, type the correct value into the table and the re-plot follows.

3

Export or Redraw

Copy the table into Excel or Google Sheets, or download CSV or .xlsx, in side-by-side columns or one long tidy table. When both axes are numeric, send the data to the scatter plot maker and get a clean SVG or 300 DPI PNG of your own.

How close are the digitized values to the real ones?

On test charts with known data, points drawn as markers or bars came back within 0.31% of the y-axis range. Smooth curves with no markers are the weak spot: the worst single point was off by 4.04%.

Chart in the testPointsAverage errorWorst point
Line chart, a marker on every point110.03% of the y range0.1% of the y range
Grouped bars, 2 series100.09% of the y range0.22% of the y range
Low-resolution JPEG with error bars70.13% of the y range0.31% of the y range
Scatter plot, 2 groups, markers overlapping240.15% of the y range0.31% of the y range
Logarithmic y axis, 2 series180.96% of the value1.41% of the value
3 smooth curves, no markers47–520.82% of the y range4.04% of the y range

Where these numbers come from

  • The test. Six charts were drawn by script from generated data, so every true value is known. The reading pipeline used on this page (same model, same prompt, same code) read each chart three times on November 11, 2026: 18 readings. The table shows the worst of the three runs for each chart, not the average.
  • How error is counted. On a linear axis: the gap between the value read and the true value, divided by the range of the y data. On the log axis: the gap divided by the true value. For a curve with no markers, each point read is compared with the curve's own formula at that x.
  • Rougher images, read once or twice. A noisy, slightly rotated grayscale JPEG made to look like a scan averaged about 2% error with a worst point near 4% over 16 points. A 60-point scatter plot came back with all 60 points within 0.5%.
  • What the test does not cover. Every test chart was computer-drawn. A photo of a projector slide, a scan with tiny labels or five curves lying on top of each other will do worse. The values are a vision model's reading of the picture, not a pixel measurement, which is why the re-plot sits next to your chart: compare the two before the numbers go anywhere.

From chart image to data to a figure of your own

Most people who digitize a plot want the chart back afterwards: in their own colours, next to their own results, or sharp enough for a slide. So the table here has a second exit besides the download buttons.

When both axes are numeric, Redraw as a scatter plot carries the series, the axis titles and any cell you corrected into the scatter plot maker. There the points are drawn by code from the numbers, not by an image model, and you can:

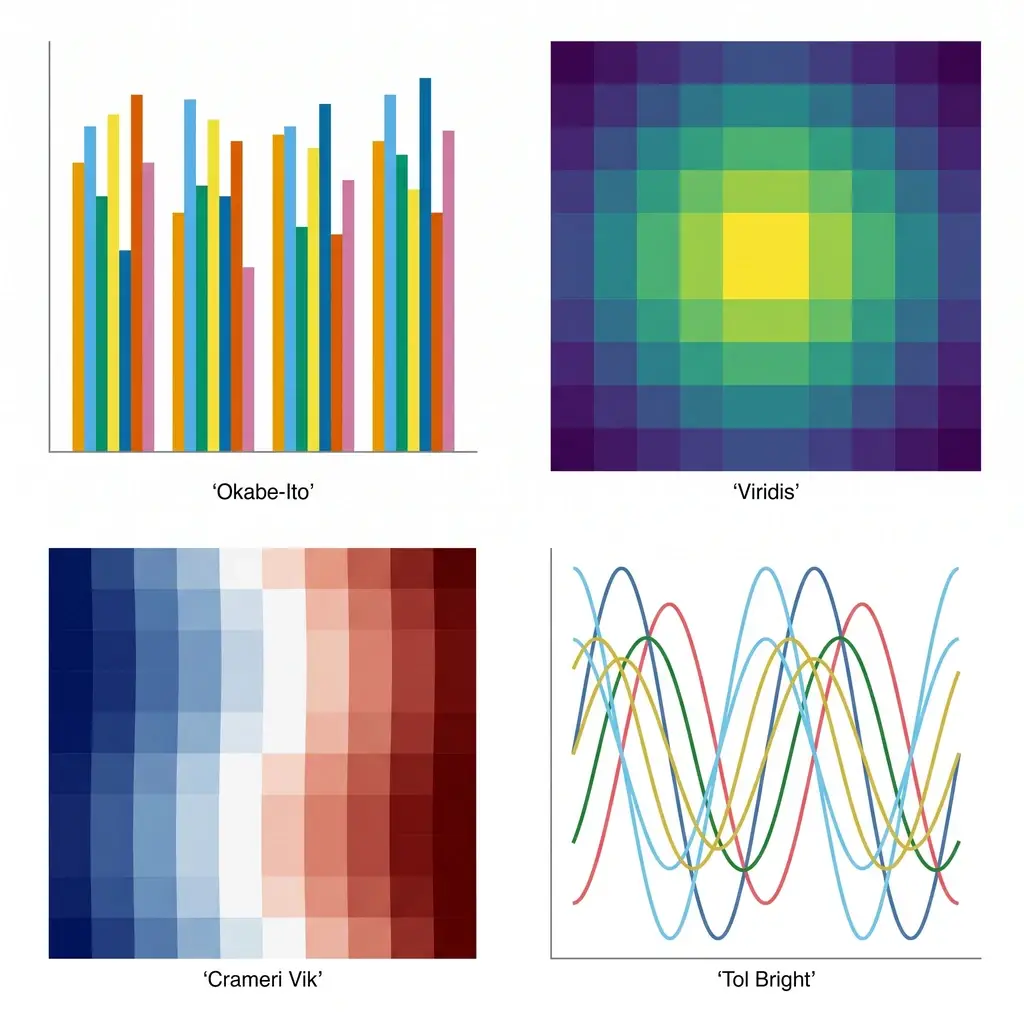
  • recolour the groups with a colourblind-safe palette,
  • add a line of best fit with its equation and R² when the data calls for one,
  • paste your own measurements under the digitized ones to compare them on one set of axes,
  • download an editable SVG or a 300 DPI PNG.

Redrawing costs nothing extra. It is offered for linear and logarithmic axes; the scatter plot maker draws on linear axes, so a log-axis chart is redrawn with the same values on a linear scale. Charts with category or date axes (bars by group, lines by month) skip this step: export the table and build the chart in your spreadsheet instead.

Which charts can be digitized, and which cannot

The tool is built for flat, two-axis charts with printed tick labels. This is the list of what has been tried, not a promise for every figure.

StatusChart types
Measured three times eachLine charts with markers, smooth curves without markers, scatter plots with groups, grouped bar charts, logarithmic axes, error bars
Read correctly in one trialDate and category axes, histograms (a count per bin), box plots (min, Q1, median, Q3, max), black-and-white lines told apart by dash style, stacked bars (a value per segment), two y axes on one chart, pie charts (a percentage per slice)
Not supportedPolar and ternary plots, maps, heat maps and contour plots, 3D surfaces, several panels in one image, password-protected PDFs

A few limits worth knowing before you start: one chart per reading, up to 12 series, and up to 600 points per series. For stacked bars and dual-axis charts the re-plot draws things side by side on one scale, so judge those two by the table, not by the shape.

Chart screenshot to Excel or CSV: for charts that never were data to you

Not every chart comes from a journal. A lot of them arrive as a slide, a page of an annual report or a screenshot in a chat, and the spreadsheet behind them is somewhere you cannot reach. Typical cases:

  • A competitor's revenue chart in an earnings deck that you need as numbers in your own model.
  • A trend line in a market report you want to extend, re-base or put on a different axis.
  • A deck you inherited where every chart is a pasted picture and the source file left with its author.
  • A textbook bar chart a teacher wants as a table for a worksheet.

The steps are the same as for a research figure: paste the screenshot, read it, check the re-plot. Then choose Copy for Excel / Sheets and paste into a cell, or download the .xlsx. Quarter, month and category labels arrive as text in the first column and each legend entry gets its own column.

Two honest notes. If the chart prints its values on the bars or points, the labels are the better source and the digitized values are only a cross-check. And if what you have is the reverse problem, Excel data that needs to become a chart, this is the wrong page: use a chart maker such as the scatter plot maker or the box plot maker.

Extracting data from a figure in a PDF paper

Published papers are where plot digitizers earn their keep: the figure is public, the data file is not, and the authors stopped answering email years ago. Open the PDF here, turn to the page, and drag a box around the panel you need. The PDF is rendered in your browser and never uploaded; only the boxed area is sent to be read, re-rendered at a higher resolution first so small tick labels stay legible.

What people take from papers this way:

  • Means and error bars for a meta-analysis when a study reports its outcome only as a figure. Each point comes back with a low and a high value, which you turn into an SD, SE or CI according to what the figure legend says the bars are.
  • A published curve to compare against your own results, redrawn on the same axes as your data.
  • Calibration, dose-response or decay curves to refit with a different model.
  • Curves from a datasheet or a standard: pump and fan curves, S-N fatigue data, derating charts.

If digitized values end up in your own publication, say so in the methods: name the tool, cite the paper the figure came from, and state that the values were read from a figure and checked against a re-plot. The guide to publication rights covers what you may reuse from other people's figures.

Which plot digitizer is best: AI reading or point-by-point tracing?

Tracing tools and an AI reader fail in different ways, so the right one depends on the chart. Facts about other tools below were taken from their own pages on November 11, 2026.

Vizcept Plot DigitizerWebPlotDigitizer 4.8 (free archived version)PlotDigitizer (free online app)graph2table
Setting up the axesRead from the tick labelsYou click known points on each axis and type their valuesYou place four calibration points and enter their valuesAutomatic, with draggable anchors
More than one seriesNamed from the legend, a column eachEach dataset traced separately, picked by colourMultiple datasets are a Pro featureAutomatic
Polar, ternary, mapsNoYesYesNot stated
ExportCSV, .xlsx, clipboardCSV, clipboardCSV, Excel, JSON, clipboardCSV, .xlsx, clipboard
AccountNot needed to tryNot neededNot neededNeeded to see the table
CostCredits per chart, with trial creditsFreeFree with limits; Pro licence sold separatelyPaid packs after free conversions
After the tableRedraw as a figure on this site———

Use an AI reader when the chart is an ordinary two-axis figure and you have more than a couple of them: the axes and all series are done in one pass, and the re-plot tells you where to look for mistakes.

Use a tracing tool such as WebPlotDigitizer or PlotDigitizer when the chart is polar, ternary or a map, when you need to place each point yourself at pixel level, or when the image must not be sent to an AI model. It takes longer per chart, and the result does not depend on a model reading the picture correctly.

Five checks before you trust digitized data

A digitized number looks as exact as a measured one once it sits in a spreadsheet. These checks take a minute and catch nearly every bad reading.

  1. Axis ends. Compare the first and last tick on each axis of the re-plot with your image. A y axis that starts at 20, not 0, is the most common source of shifted values.
  2. Scale type. The line under the result title says linear, logarithmic, categories or dates for each axis. If a log axis was read as linear, every value between the ticks is wrong; read the chart again.
  3. Point count. Count the markers on one series in your image and compare with the number shown next to the series name.
  4. Overlaps. Where two series cross or sit on top of each other, look at the re-plot at that spot and at any warning listed above the table.
  5. One value you know. If the text of the paper or the slide states a number that is on the chart, find it in the table. If it matches, the calibration is right.

What this graph digitizer does

Reading, checking, and what comes after

The reading is done by a vision model; everything you see afterwards, the re-plot, the table and the exported files, is computed from the numbers in the table.

Axes

Axes Read from the Tick Labels

Linear, log, dates or categories

The printed tick labels set the scale, so there are no calibration points to click. Logarithmic axes are interpolated in log space, and date or category labels are kept as text.

Series

A Column for Every Legend Entry

Names and colours from the legend

Each line, marker group or bar group becomes its own named column. Curves without markers are sampled at 20 to 30 positions, with extra points at peaks and bends.

Check

A Re-Plot Beside the Original

See a wrong value before you use it

The data read is drawn again next to your image on a white background. A point that sits in the wrong place shows up at once, and the table has warnings for hidden or overlapping parts.

Edit

Every Cell Can Be Corrected

Fix, delete, re-plot

Click a value and type the right one; the re-plot updates. Delete a stray point in the long layout. Error bars come back as low and high columns next to each mean.

PDF

Figures Straight from a PDF

The file stays on your computer

Open a paper or a report, page to the figure and drag a box around it. The PDF is handled in your browser; only the boxed chart is sent, and the image is not kept after it is read.

Output

CSV, Excel, or a New Figure

Columns or one tidy table

Copy to the clipboard for Excel or Sheets, download CSV or .xlsx, or send numeric data to the scatter plot maker and export an editable SVG or a 300 DPI PNG.

Plot digitizer questions

Cost, accuracy, file types and limits

Reading a chart is paid, because each reading runs a vision model that costs money: it takes 2 credits per chart. Plans start at $14.90 a month and one-time credit packs at $19.90; packs never renew. To try it you do not need an account, since trial credits cover your first readings, and new accounts get sign-up credits plus daily check-in credits. Opening the sample charts, editing the table, exporting CSV or Excel and redrawing in the scatter plot maker use no credits. A fully free route is a manual tool such as WebPlotDigitizer 4.8, where you calibrate the axes and click the points yourself.

Upload the chart image, paste a screenshot, or open a PDF and box the figure. Press Read chart data and wait about 10 to 30 seconds. Compare the re-plot with your image, correct any cell that is off, then copy the table or download it as CSV or Excel.

It depends on what you need after the numbers. For an ordinary two-axis chart that you want as a table and then as a figure of your own, use an AI reader such as this one: it reads the axes and every series in one pass, and when both axes are numeric the table can go straight to a scatter plot maker to be redrawn. For polar plots, ternary diagrams or maps, or when you want to place each point by hand, use a tracing tool such as WebPlotDigitizer or PlotDigitizer.

Yes. This graph digitizer runs in the browser on Windows, macOS, Linux, tablets and phones. There is no desktop download and no offline mode, because the reading is done by a model on the server.

Not this one. Vizcept Plot Digitizer runs only in the browser, because a model on the server does the reading, so there is no installer and no offline mode. If you need software on your own machine, WebPlotDigitizer publishes its source code on GitHub, the older Java program called Plot Digitizer is a download on SourceForge, and PlotDigitizer sells an offline version for Windows, Mac and Linux with its Pro licence.

In a test on charts with known data (November 11, 2026), points drawn as markers or bars were within 0.31% of the y-axis range, values on a logarithmic axis within 1.41% of the value, and smooth curves without markers within 4.04% at the worst point. Scans, photos and overlapping curves are less exact, so always compare the re-plot with the original.

You can, and for one simple bar chart it often works. What a chat window does not give you is a way to check the answer: the values come back as text, with no re-plot beside your image, no warnings about hidden parts and no table you can correct and export. This tool is built around that check, and it forces the model to read the axis ticks before it estimates any point.

Yes. Paste the screenshot with Ctrl/⌘ + V, read it, then choose Download Excel (.xlsx) or Copy for Excel / Sheets. Category and date labels go in the first column and each series gets its own column. If your goal is the opposite, a chart from Excel data, use a chart maker instead.

Yes. Choose the PDF, go to the page and drag a box around one figure, or use the whole page. The PDF is opened in your browser and is not uploaded; only the selected chart is sent to be read. Password-protected PDFs cannot be opened, so paste a screenshot of the figure instead.

Both. An axis whose ticks go 1, 10, 100 or 10³, 10⁴ is treated as logarithmic and values are interpolated in log space. Error bars are returned as a low and a high value for each point; whether they are SD, SE or a confidence interval is something only the figure legend can tell you.

Polar and ternary plots, maps, heat maps, contour plots and 3D surfaces are not supported. Figures with several panels need to be cropped to one panel. Dense charts where many curves overlap, and smooth curves with no markers, are read less exactly than charts with clear markers.

No. It reads one chart per run, and you pick each figure yourself. For a paper with ten figures that means ten readings. There is no batch upload and no API.

It opens the scatter plot maker with your table already filled in, including any cell you corrected and the axis titles read from the chart. From there you can restyle the plot, add a line of best fit, paste your own data next to it and download an SVG or a 300 DPI PNG. It is available when both axes are numeric.

No. The image is sent to the AI model to be read and is not saved to storage or to a database. A PDF never leaves your browser. The table of numbers that was read is saved to your history so you can open it again; the original image is not part of it.

WebPlotDigitizer 4.8, the archived version, is free and needs no account; the newer version 5 asks you to log in. In both you calibrate the axes by hand, and version 5 adds an AI assist for part of the work. This tool reads the axes and all series in one step and adds a re-plot check and a redraw step, but it cannot do polar plots, ternary diagrams or maps, which WebPlotDigitizer can.

Cite the paper or report the figure came from, and describe the extraction in your methods, for example: "Values were extracted from Figure 2 of Smith et al. (2021) using Vizcept Plot Digitizer (vizcept.com) and verified against a re-plot." For a meta-analysis, also state how error bars were converted to SD or SE.

Get the numbers out of that chart

Paste a screenshot or open a PDF, check the re-plot, and leave with a table you can export or a figure you can redraw.

Featured on Findly.tools